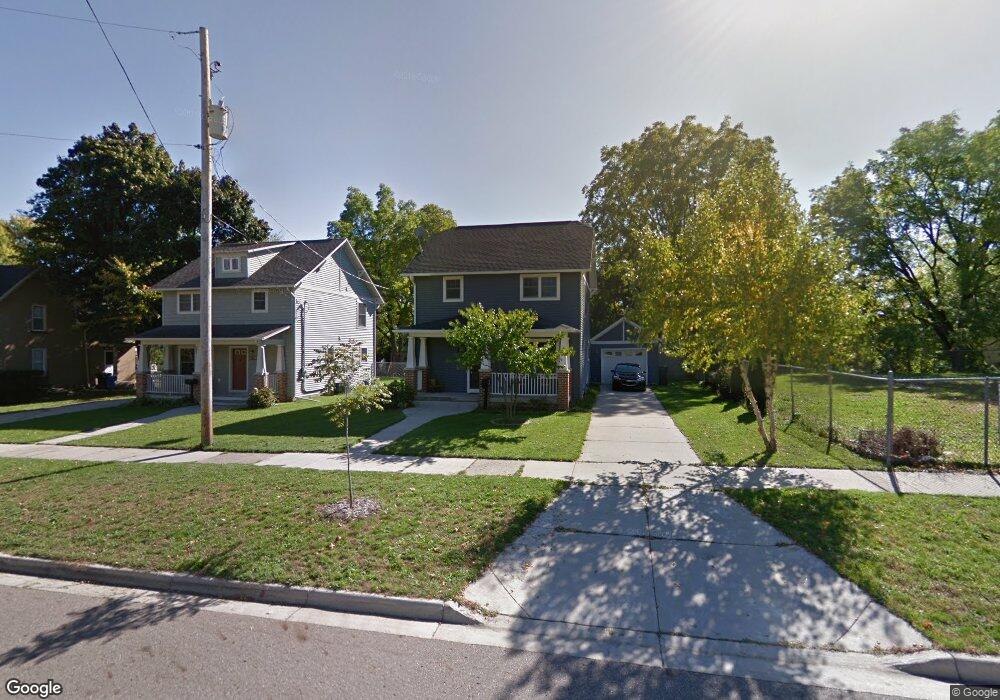
615 W Maple St Lansing, MI 48906
Old Forest NeighborhoodEstimated Value: $144,000 - $235,000
3
Beds
2
Baths
1,400
Sq Ft
$127/Sq Ft
Est. Value
About This Home
This home is located at 615 W Maple St, Lansing, MI 48906 and is currently estimated at $177,375, approximately $126 per square foot. 615 W Maple St is a home located in Ingham County with nearby schools including Willow School, Pattengill Academy, and J.W. Sexton High School.
Ownership History
Date
Name
Owned For
Owner Type
Purchase Details
Closed on
Jul 26, 2016
Sold by
Murrany Tereasa and Murrany Sean E
Bought by
Murray Sean E
Current Estimated Value
Home Financials for this Owner
Home Financials are based on the most recent Mortgage that was taken out on this home.
Original Mortgage
$84,452
Interest Rate
3.48%
Mortgage Type
FHA
Purchase Details
Closed on
May 11, 2010
Sold by
Franklin Street Housing Community Corpor
Bought by
Gordon Teresa
Home Financials for this Owner
Home Financials are based on the most recent Mortgage that was taken out on this home.
Original Mortgage
$82,773
Interest Rate
5.12%
Mortgage Type
FHA
Create a Home Valuation Report for This Property
The Home Valuation Report is an in-depth analysis detailing your home's value as well as a comparison with similar homes in the area
Home Values in the Area
Average Home Value in this Area
Purchase History
| Date | Buyer | Sale Price | Title Company |
|---|---|---|---|
| Murray Sean E | $85,000 | None Available | |
| Gordon Teresa | $87,000 | Transnation Title Agency |
Source: Public Records
Mortgage History
| Date | Status | Borrower | Loan Amount |
|---|---|---|---|
| Previous Owner | Murray Sean E | $84,452 | |
| Previous Owner | Gordon Teresa | $82,773 |
Source: Public Records
Tax History
| Year | Tax Paid | Tax Assessment Tax Assessment Total Assessment is a certain percentage of the fair market value that is determined by local assessors to be the total taxable value of land and additions on the property. | Land | Improvement |
|---|---|---|---|---|
| 2025 | $2,871 | $73,700 | $5,600 | $68,100 |
| 2024 | $23 | $56,700 | $5,600 | $51,100 |
| 2023 | $2,692 | $51,000 | $5,600 | $45,400 |
| 2022 | $2,428 | $47,900 | $5,300 | $42,600 |
| 2021 | $2,377 | $47,900 | $6,600 | $41,300 |
| 2020 | $2,363 | $46,600 | $6,600 | $40,000 |
| 2019 | $2,265 | $44,000 | $6,600 | $37,400 |
| 2018 | $2,123 | $42,900 | $6,600 | $36,300 |
| 2017 | $2,671 | $42,900 | $6,600 | $36,300 |
| 2016 | $1,943 | $42,100 | $6,600 | $35,500 |
| 2015 | $1,943 | $41,300 | $13,261 | $28,039 |
| 2014 | $1,943 | $34,500 | $5,967 | $28,533 |
Source: Public Records
Map
Nearby Homes
- 925 N Pine St
- 921 N Sycamore St
- 904 N Sycamore St
- 409 W César E Chávez Ave
- 1023 Seymour Ave
- 908 N Walnut St
- 733 N Pine St
- 1315 Roosevelt Ave
- 406 Pleasant St
- 733 N Walnut St
- 919 Princeton Ave
- 745 Chicago Ave
- 809 Seymour Ave
- 1226 N Grand River Ave
- 1019 Daleford Ave
- 814 N Martin Luther King jr Blvd
- 933 N Martin Luther King Junior Blvd
- 920 N Capitol Ave Unit 1
- 908 N Capitol Ave
- 312 W Saginaw St Unit 1
Your Personal Tour Guide
Ask me questions while you tour the home.