615 Walnut St Martins Ferry, OH 43935
Estimated Value: $73,000 - $112,000
4
Beds
2
Baths
3,304
Sq Ft
$26/Sq Ft
Est. Value
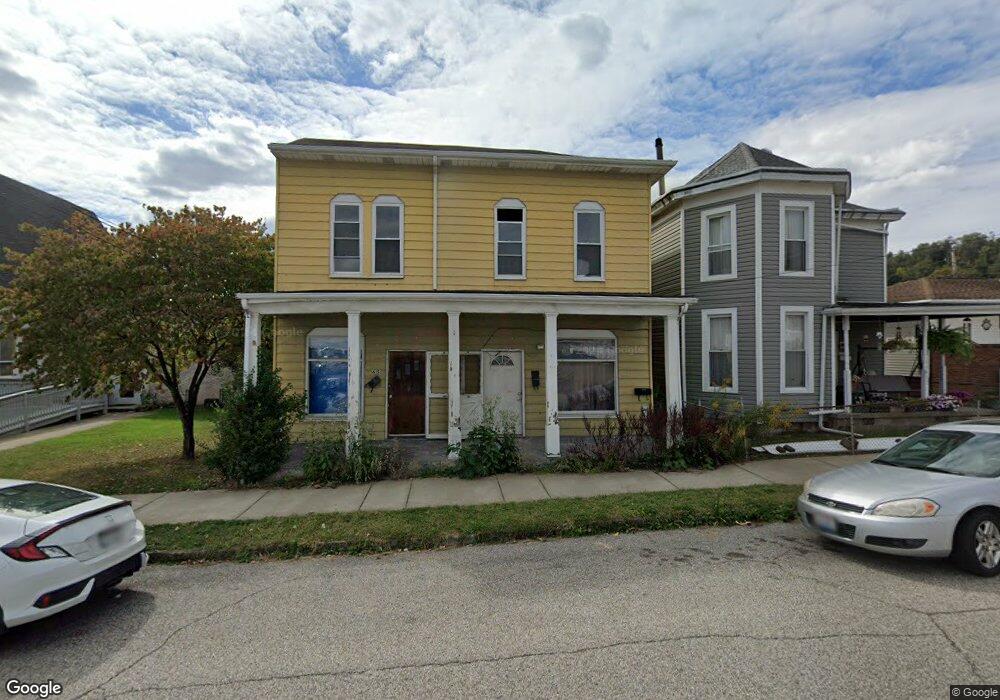
About This Home
This home is located at 615 Walnut St, Martins Ferry, OH 43935 and is currently estimated at $87,348, approximately $26 per square foot. 615 Walnut St is a home located in Belmont County with nearby schools including Anna Marie Ayers Elementary School, Martins Ferry Middle School, and Martins Ferry High School.
Ownership History
Date
Name
Owned For
Owner Type
Purchase Details
Closed on
Nov 7, 2016
Sold by
Fannie Mae
Bought by
Hughes Development Co Llc
Current Estimated Value
Purchase Details
Closed on
May 31, 2016
Sold by
Yager Thomas K
Bought by
Federal National Mortgage Association
Purchase Details
Closed on
Feb 15, 2000
Sold by
Yager Thomas K and Yager Linda K
Bought by
Yager Thomas K and Yager Linda K
Purchase Details
Closed on
Jan 1, 1986
Sold by
Vogler Harry and Vogler Dolores W
Bought by
Vogler Harry and Vogler Dolores W
Create a Home Valuation Report for This Property
The Home Valuation Report is an in-depth analysis detailing your home's value as well as a comparison with similar homes in the area
Home Values in the Area
Average Home Value in this Area
Purchase History
| Date | Buyer | Sale Price | Title Company |
|---|---|---|---|
| Hughes Development Co Llc | -- | Servicelink | |
| Federal National Mortgage Association | $66,666 | Attorney | |
| Yager Thomas K | $25,300 | -- | |
| Vogler Harry | -- | -- |
Source: Public Records
Tax History Compared to Growth
Tax History
| Year | Tax Paid | Tax Assessment Tax Assessment Total Assessment is a certain percentage of the fair market value that is determined by local assessors to be the total taxable value of land and additions on the property. | Land | Improvement |
|---|---|---|---|---|
| 2024 | $1,306 | $24,830 | $1,870 | $22,960 |
| 2023 | $1,537 | $18,860 | $1,790 | $17,070 |
| 2022 | $1,568 | $18,858 | $1,788 | $17,070 |
| 2021 | $2,180 | $18,862 | $1,792 | $17,070 |
| 2020 | $1,257 | $16,400 | $1,560 | $14,840 |
| 2019 | $6,493 | $16,400 | $1,560 | $14,840 |
| 2018 | $1,662 | $16,400 | $1,560 | $14,840 |
| 2017 | $632 | $12,980 | $1,660 | $11,320 |
| 2016 | $1,467 | $12,980 | $1,660 | $11,320 |
| 2015 | $1,338 | $12,980 | $1,660 | $11,320 |
| 2014 | $1,677 | $12,290 | $1,510 | $10,780 |
| 2013 | $519 | $12,290 | $1,510 | $10,780 |
Source: Public Records
Map
Nearby Homes