Estimated Value: $310,005 - $366,000
3
Beds
2
Baths
2,398
Sq Ft
$139/Sq Ft
Est. Value
About This Home
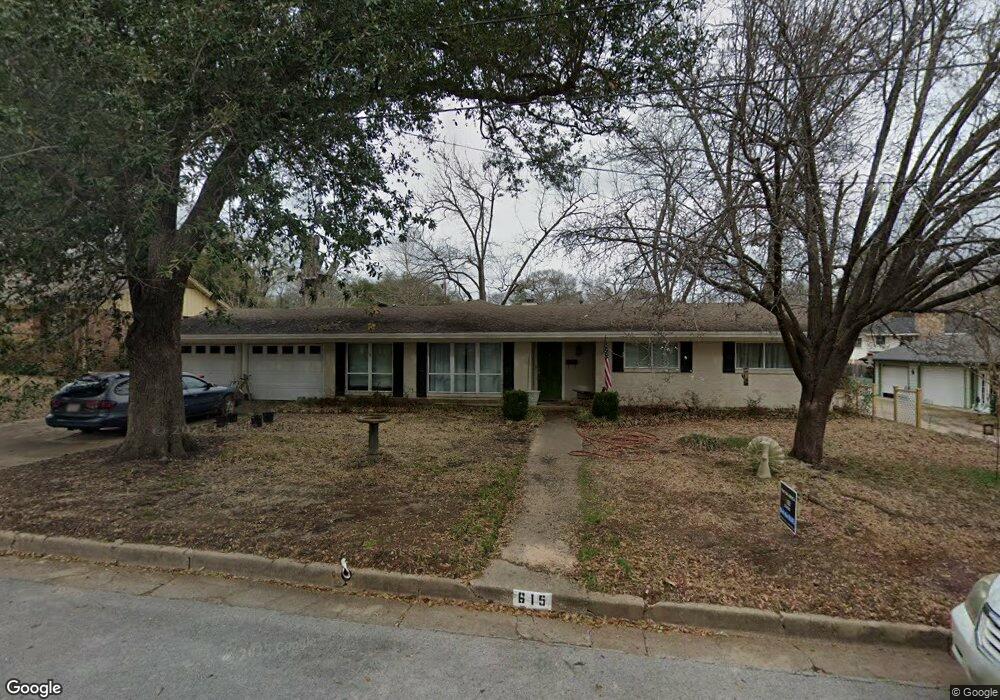
This home is located at 615 Whittle St, Tyler, TX 75701 and is currently estimated at $334,251, approximately $139 per square foot. 615 Whittle St is a home located in Smith County with nearby schools including Woods Elementary School, Hubbard Middle School, and Tyler Legacy High School.
Ownership History
Date
Name
Owned For
Owner Type
Purchase Details
Closed on
Dec 21, 2015
Sold by
Jones Camden and Jones Amanda
Bought by
Goeders Sarah E
Current Estimated Value
Home Financials for this Owner
Home Financials are based on the most recent Mortgage that was taken out on this home.
Original Mortgage
$175,500
Outstanding Balance
$106,587
Interest Rate
4.03%
Mortgage Type
New Conventional
Estimated Equity
$227,664
Purchase Details
Closed on
Nov 5, 2008
Sold by
Bryson James Gordon and Bryson Arona T
Bought by
Jones Camden and Jones Amanda
Home Financials for this Owner
Home Financials are based on the most recent Mortgage that was taken out on this home.
Original Mortgage
$148,500
Interest Rate
6.08%
Mortgage Type
Purchase Money Mortgage
Create a Home Valuation Report for This Property
The Home Valuation Report is an in-depth analysis detailing your home's value as well as a comparison with similar homes in the area
Home Values in the Area
Average Home Value in this Area
Purchase History
| Date | Buyer | Sale Price | Title Company |
|---|---|---|---|
| Goeders Sarah E | -- | None Available | |
| Jones Camden | -- | None Available | |
| Jones Camden | -- | None Available |
Source: Public Records
Mortgage History
| Date | Status | Borrower | Loan Amount |
|---|---|---|---|
| Open | Goeders Sarah E | $175,500 | |
| Previous Owner | Jones Camden | $148,500 |
Source: Public Records
Tax History Compared to Growth
Tax History
| Year | Tax Paid | Tax Assessment Tax Assessment Total Assessment is a certain percentage of the fair market value that is determined by local assessors to be the total taxable value of land and additions on the property. | Land | Improvement |
|---|---|---|---|---|
| 2025 | $3,479 | $357,715 | $79,981 | $277,734 |
| 2024 | $3,479 | $303,271 | $31,920 | $299,822 |
| 2023 | $3,761 | $340,985 | $31,920 | $309,065 |
| 2022 | $4,910 | $325,337 | $31,920 | $293,417 |
| 2021 | $4,780 | $227,852 | $18,240 | $209,612 |
| 2020 | $4,804 | $224,499 | $18,240 | $206,259 |
| 2019 | $4,706 | $215,213 | $18,240 | $196,973 |
| 2018 | $4,495 | $206,684 | $18,240 | $188,444 |
| 2017 | $4,336 | $206,684 | $18,240 | $188,444 |
| 2016 | $3,942 | $184,628 | $18,240 | $166,388 |
| 2015 | $2,292 | $115,359 | $18,240 | $97,119 |
| 2014 | $2,292 | $118,817 | $18,240 | $100,577 |
Source: Public Records
Map
Nearby Homes
- 0 Us Highway 271
- 2917 Sunnybrook Dr
- 640 Beechwood Dr
- 789 Fairmont Dr
- 509 Buckingham Place
- 505 Buckingham Place
- 1111 Beechwood Dr
- 403 Beechwood Dr
- 309 Glenhaven Dr
- 2900 S Robertson Ave
- 3045 Concord Place
- 3048 Concord Place
- 3324 Teakwood Dr
- 3300 Old Bullard Rd
- 3308 Greenoak Place
- 2622 Oak Ln
- 2736 Old Bullard Rd
- 121 Fair Ln
- 2835 S Broadway Ave
- 2809 S Robertson Ave