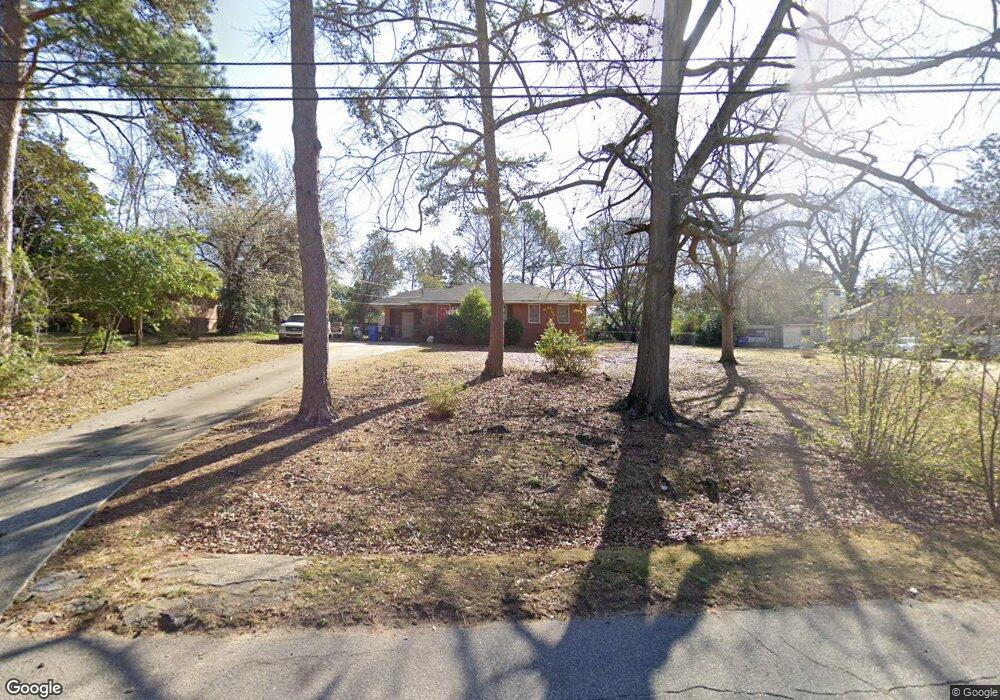
6150 Arrington Dr Columbus, GA 31909
Northern Columbus NeighborhoodEstimated Value: $153,582 - $173,000
3
Beds
1
Bath
1,054
Sq Ft
$155/Sq Ft
Est. Value
About This Home
This home is located at 6150 Arrington Dr, Columbus, GA 31909 and is currently estimated at $163,396, approximately $155 per square foot. 6150 Arrington Dr is a home located in Muscogee County with nearby schools including Gentian Elementary School, Blackmon Road Middle School, and Hardaway High School.
Ownership History
Date
Name
Owned For
Owner Type
Purchase Details
Closed on
Feb 19, 2020
Sold by
Clark Philip Jerome
Bought by
Vande Vusse Marrisa G
Current Estimated Value
Home Financials for this Owner
Home Financials are based on the most recent Mortgage that was taken out on this home.
Original Mortgage
$92,205
Outstanding Balance
$81,485
Interest Rate
3.5%
Mortgage Type
FHA
Estimated Equity
$81,911
Purchase Details
Closed on
Jul 23, 2010
Sold by
Deal Dennis
Bought by
Clark Philip Jerome
Home Financials for this Owner
Home Financials are based on the most recent Mortgage that was taken out on this home.
Original Mortgage
$83,333
Interest Rate
4.25%
Mortgage Type
FHA
Purchase Details
Closed on
Dec 1, 2009
Sold by
Mahaffey Jennifer E and Mahaffey Jason P
Bought by
Deal Dennis
Create a Home Valuation Report for This Property
The Home Valuation Report is an in-depth analysis detailing your home's value as well as a comparison with similar homes in the area
Home Values in the Area
Average Home Value in this Area
Purchase History
| Date | Buyer | Sale Price | Title Company |
|---|---|---|---|
| Vande Vusse Marrisa G | $99,500 | -- | |
| Clark Philip Jerome | $85,500 | None Available | |
| Deal Dennis | $57,686 | None Available |
Source: Public Records
Mortgage History
| Date | Status | Borrower | Loan Amount |
|---|---|---|---|
| Open | Vande Vusse Marrisa G | $92,205 | |
| Previous Owner | Clark Philip Jerome | $83,333 |
Source: Public Records
Tax History Compared to Growth
Tax History
| Year | Tax Paid | Tax Assessment Tax Assessment Total Assessment is a certain percentage of the fair market value that is determined by local assessors to be the total taxable value of land and additions on the property. | Land | Improvement |
|---|---|---|---|---|
| 2025 | $1,028 | $46,048 | $7,956 | $38,092 |
| 2024 | $1,027 | $46,048 | $7,956 | $38,092 |
| 2023 | $339 | $46,048 | $7,956 | $38,092 |
| 2022 | $1,070 | $38,844 | $7,956 | $30,888 |
| 2021 | $1,064 | $39,440 | $7,956 | $31,484 |
| 2020 | $850 | $33,148 | $7,956 | $25,192 |
| 2019 | $854 | $33,148 | $7,956 | $25,192 |
| 2018 | $854 | $33,148 | $7,956 | $25,192 |
| 2017 | $859 | $33,148 | $7,956 | $25,192 |
| 2016 | $863 | $34,200 | $3,378 | $30,822 |
| 2015 | $865 | $34,200 | $3,378 | $30,822 |
| 2014 | $867 | $34,200 | $3,378 | $30,822 |
| 2013 | -- | $34,200 | $3,378 | $30,822 |
Source: Public Records
Map
Nearby Homes
- 6158 Arrington Dr
- 4320 Canady St
- 6136 Morningside Dr
- 5926 Frazier Dr
- 5915 Frazier Dr
- 5921 Lawson St
- 6104 Candlestick Loop
- 5866 Morningside Dr
- 4036 Wilbur Dr
- 4847 Warm Springs Rd
- 5829 Moon Rd
- 4245 N Oaks Dr
- 5636 Webb Ave
- 4627 Wimbish Ct
- 5028 Warm Springs Rd
- 5224 Miller Rd
- 6500 Charter Oaks Cir
- 5623 Hodges Dr
- 4417 Sibley St
- 3824 Lyn Dr
- 6146 Arrington Dr
- 6067 Frazier Dr
- 6113 Frazier Dr
- 6164 Arrington Dr
- 6140 Arrington Dr
- 6049 Frazier Dr
- 6137 Arrington Dr
- 6121 Frazier Dr
- 6170 Arrington Dr
- 6159 Arrington Dr
- 6039 Frazier Dr
- 6129 Frazier Dr
- 6136 Arrington Dr
- 6127 Arrington Dr
- 6167 Arrington Dr
- 6176 Arrington Dr
- 6031 Frazier Dr
- 6137 Frazier Dr
- 4413 Canady St
- 6128 Arrington Dr