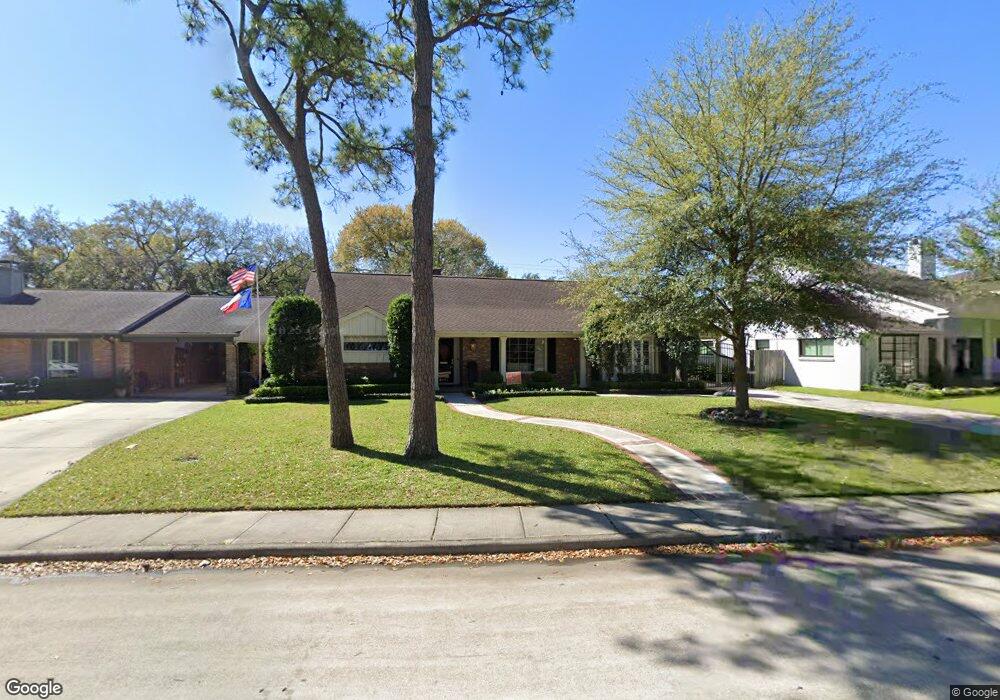
6151 Piping Rock Ln Houston, TX 77057
Uptown-Galleria District NeighborhoodEstimated Value: $1,083,000 - $1,568,000
4
Beds
3
Baths
2,856
Sq Ft
$440/Sq Ft
Est. Value
About This Home
This home is located at 6151 Piping Rock Ln, Houston, TX 77057 and is currently estimated at $1,257,232, approximately $440 per square foot. 6151 Piping Rock Ln is a home located in Harris County with nearby schools including Briargrove Elementary School, Tanglewood Middle, and Wisdom High School.
Ownership History
Date
Name
Owned For
Owner Type
Purchase Details
Closed on
Oct 29, 2021
Sold by
Hogan Martin Thomas and Hogan Kristyn Leigh
Bought by
Salvi Luca and Bernardini Michelle S
Current Estimated Value
Home Financials for this Owner
Home Financials are based on the most recent Mortgage that was taken out on this home.
Original Mortgage
$555,000
Outstanding Balance
$507,780
Interest Rate
2.88%
Mortgage Type
New Conventional
Estimated Equity
$749,452
Purchase Details
Closed on
Feb 22, 2012
Sold by
Young Joseph G and Young Elizabeth M
Bought by
Hogan Martin Thomas and Hogan Kristyn Leigh
Home Financials for this Owner
Home Financials are based on the most recent Mortgage that was taken out on this home.
Original Mortgage
$275,000
Interest Rate
3.95%
Mortgage Type
New Conventional
Create a Home Valuation Report for This Property
The Home Valuation Report is an in-depth analysis detailing your home's value as well as a comparison with similar homes in the area
Home Values in the Area
Average Home Value in this Area
Purchase History
| Date | Buyer | Sale Price | Title Company |
|---|---|---|---|
| Salvi Luca | -- | Fidelity National Title | |
| Salvi Luca | -- | Fidelity National Title | |
| Hogan Martin Thomas | -- | Etc |
Source: Public Records
Mortgage History
| Date | Status | Borrower | Loan Amount |
|---|---|---|---|
| Open | Salvi Luca | $555,000 | |
| Closed | Salvi Luca | $555,000 | |
| Previous Owner | Hogan Martin Thomas | $275,000 |
Source: Public Records
Tax History Compared to Growth
Tax History
| Year | Tax Paid | Tax Assessment Tax Assessment Total Assessment is a certain percentage of the fair market value that is determined by local assessors to be the total taxable value of land and additions on the property. | Land | Improvement |
|---|---|---|---|---|
| 2025 | $15,178 | $1,125,658 | $630,680 | $494,978 |
| 2024 | $15,178 | $956,994 | $551,845 | $405,149 |
| 2023 | $15,178 | $986,304 | $551,845 | $434,459 |
| 2022 | $21,310 | $967,794 | $551,845 | $415,949 |
| 2021 | $20,100 | $862,434 | $520,311 | $342,123 |
| 2020 | $19,272 | $795,836 | $520,311 | $275,525 |
| 2019 | $19,687 | $778,000 | $520,311 | $257,689 |
| 2018 | $16,014 | $802,000 | $433,593 | $368,407 |
| 2017 | $20,279 | $802,000 | $433,593 | $368,407 |
| 2016 | $20,328 | $832,700 | $433,593 | $399,107 |
| 2015 | $13,555 | $835,000 | $433,593 | $401,407 |
| 2014 | $13,555 | $717,000 | $433,593 | $283,407 |
Source: Public Records
Map
Nearby Homes
- 6143 Ella Lee Ln
- 2410 Briar Ridge Dr
- 6213 Overbrook Ln
- 2417 Jamestown Mall Unit 24
- 2501 Briarhurst Dr
- 2309 Potomac Dr
- 6024 Burgoyne Rd
- 2403 Potomac Dr
- 2421 Potomac Dr Unit C
- 6230 Locke Ln
- 2422 Nantucket Dr Unit C
- 2430 Nantucket Dr Unit B
- 2222 Nantucket Dr Unit B
- 2218 Nantucket Dr
- 2113 Potomac Dr Unit D
- 6249 Locke Ln
- 2514 Nantucket Dr Unit C
- 6007 Potomac Park Dr
- 6429 Burgoyne Rd Unit 15
- 6404 Burgoyne Rd Unit 159
- 6147 Piping Rock Ln
- 6150 Ella Lee Ln
- 6154 Ella Lee Ln
- 6159 Piping Rock Ln
- 6146 Ella Lee Ln
- 6143 Piping Rock Ln
- 6150 Piping Rock Ln
- 6146 Piping Rock Ln
- 6154 Piping Rock Ln
- 6158 Ella Lee Ln
- 6142 Ella Lee Ln
- 6161 Piping Rock Ln
- 6142 Piping Rock Ln
- 6139 Piping Rock Ln
- 6158 Piping Rock Ln
- 6138 Ella Lee Ln
- 6138 Piping Rock Ln
- 6147 Burgoyne Rd
- 6143 Burgoyne Rd
- 6151 Burgoyne Rd