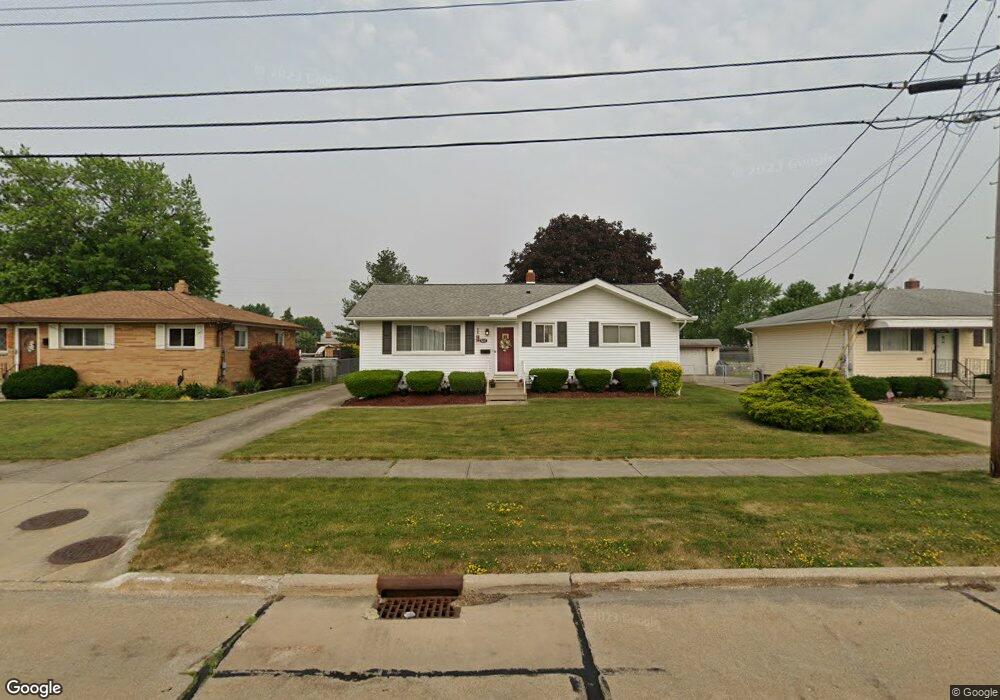
6152 Hardin Dr Brookpark, OH 44142
Estimated Value: $215,393 - $237,000
2
Beds
2
Baths
984
Sq Ft
$232/Sq Ft
Est. Value
About This Home
This home is located at 6152 Hardin Dr, Brookpark, OH 44142 and is currently estimated at $228,098, approximately $231 per square foot. 6152 Hardin Dr is a home located in Cuyahoga County with nearby schools including Berea-Midpark Middle School, Berea-Midpark High School, and Huber Heights Preparatory Academy Parma Academy.
Ownership History
Date
Name
Owned For
Owner Type
Purchase Details
Closed on
Oct 10, 2012
Sold by
Treher Craig A
Bought by
Treher Kim R
Current Estimated Value
Purchase Details
Closed on
Apr 15, 1998
Sold by
Milicevic Larry D and Milicevic Lynn M
Bought by
Treher Craig A and Treher Kim R
Home Financials for this Owner
Home Financials are based on the most recent Mortgage that was taken out on this home.
Original Mortgage
$101,100
Outstanding Balance
$19,478
Interest Rate
7.27%
Estimated Equity
$208,620
Purchase Details
Closed on
Jul 31, 1992
Sold by
Gassner Gary M
Bought by
Milicevic Larry D
Purchase Details
Closed on
Jan 3, 1984
Sold by
Clement John C
Bought by
Gassner Gary M
Purchase Details
Closed on
Apr 19, 1976
Sold by
Clement John C and Clement Gloria A
Bought by
Clement John C
Purchase Details
Closed on
Jan 1, 1975
Bought by
Clement John C and Clement Gloria A
Create a Home Valuation Report for This Property
The Home Valuation Report is an in-depth analysis detailing your home's value as well as a comparison with similar homes in the area
Home Values in the Area
Average Home Value in this Area
Purchase History
| Date | Buyer | Sale Price | Title Company |
|---|---|---|---|
| Treher Kim R | -- | Attorney | |
| Treher Craig A | $119,000 | Midland Title Security Inc | |
| Milicevic Larry D | $87,000 | -- | |
| Gassner Gary M | $50,000 | -- | |
| Clement John C | -- | -- | |
| Clement John C | -- | -- |
Source: Public Records
Mortgage History
| Date | Status | Borrower | Loan Amount |
|---|---|---|---|
| Open | Treher Craig A | $101,100 |
Source: Public Records
Tax History Compared to Growth
Tax History
| Year | Tax Paid | Tax Assessment Tax Assessment Total Assessment is a certain percentage of the fair market value that is determined by local assessors to be the total taxable value of land and additions on the property. | Land | Improvement |
|---|---|---|---|---|
| 2024 | $3,778 | $74,900 | $12,565 | $62,335 |
| 2023 | $3,017 | $49,530 | $9,000 | $40,530 |
| 2022 | $2,996 | $49,530 | $9,000 | $40,530 |
| 2021 | $2,978 | $49,530 | $9,000 | $40,530 |
| 2020 | $2,685 | $39,310 | $7,140 | $32,170 |
| 2019 | $2,605 | $112,300 | $20,400 | $91,900 |
| 2018 | $2,594 | $39,310 | $7,140 | $32,170 |
| 2017 | $2,609 | $36,510 | $6,370 | $30,140 |
| 2016 | $2,587 | $36,510 | $6,370 | $30,140 |
| 2015 | $2,428 | $36,510 | $6,370 | $30,140 |
| 2014 | $2,428 | $36,510 | $6,370 | $30,140 |
Source: Public Records
Map
Nearby Homes
- 6195 Hardin Dr
- 14890 Holland Rd
- 15450 Holland Rd
- 15800 Holland Rd
- 6363 Lockhaven Dr
- 14344 Fayette Blvd
- 6378 Edgehurst Dr
- 16051 Holland Rd
- 14055 Donald Dr
- 14417 Parkman Blvd
- 16310 Richard Dr
- 6470 Sandfield Dr
- 5677 Gateway Ln Unit E504
- 13971 Park Dr
- 15446 Sheldon Rd
- 13489 Havendale Dr
- 13602 Holland Rd
- 13879 Zaremba Dr
- 14340 Kingman Dr
- 16259 Emerald Point Unit 16259
- 6142 Hardin Dr
- 6164 Hardin Dr
- 6130 Hardin Dr
- 6174 Hardin Dr
- 6186 Hardin Dr
- 6141 Hardin Dr
- 6165 Hardin Dr
- 15003 Sylvia Dr
- 15025 Sylvia Dr
- 6131 Hardin Dr
- 6175 Hardin Dr
- 15049 Sylvia Dr
- 6196 Hardin Dr
- 6185 Hardin Dr
- 6123 Hardin Dr
- 15073 Sylvia Dr
- 14930 Greystone Dr
- 14929 Greystone Dr
- 6115 Hardin Dr
- 6206 Hardin Dr