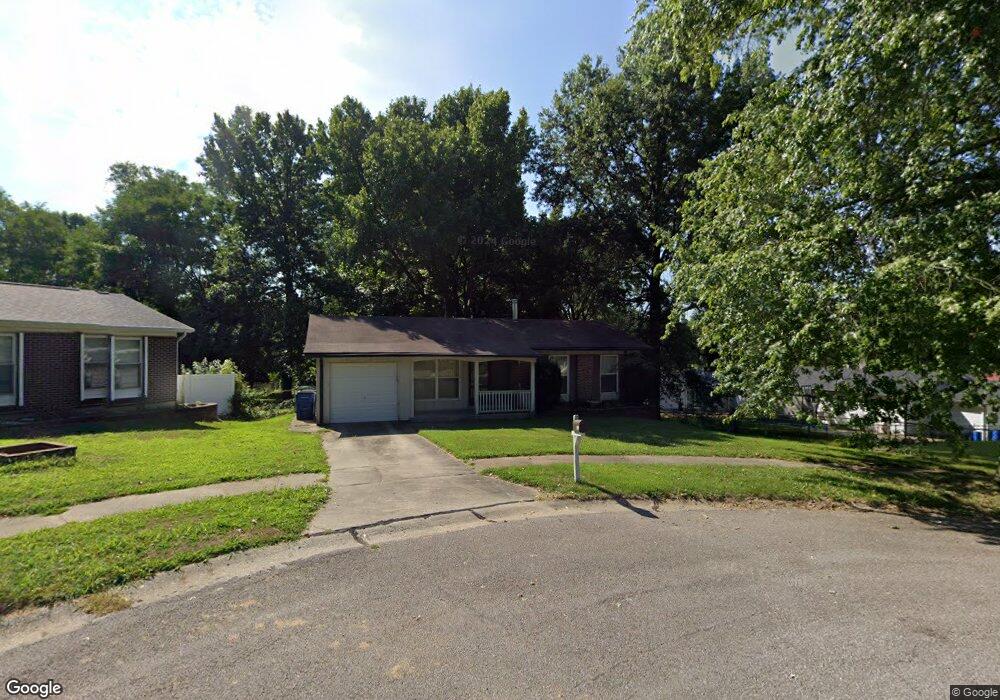
6154 Red Wagon Ct Florissant, MO 63033
Estimated Value: $173,070 - $195,000
3
Beds
2
Baths
1,144
Sq Ft
$163/Sq Ft
Est. Value
About This Home
This home is located at 6154 Red Wagon Ct, Florissant, MO 63033 and is currently estimated at $186,268, approximately $162 per square foot. 6154 Red Wagon Ct is a home located in St. Louis County with nearby schools including Townsend Elementary School, Central Middle School, and Hazelwood Central High School.
Ownership History
Date
Name
Owned For
Owner Type
Purchase Details
Closed on
Nov 10, 2008
Sold by
Young Earl
Bought by
Young Lonnie
Current Estimated Value
Purchase Details
Closed on
May 14, 2004
Sold by
Rjm Investment Development Corp
Bought by
Young Early
Home Financials for this Owner
Home Financials are based on the most recent Mortgage that was taken out on this home.
Original Mortgage
$104,025
Interest Rate
6.07%
Mortgage Type
Purchase Money Mortgage
Purchase Details
Closed on
Mar 27, 2003
Sold by
Hughes Sharon R
Bought by
The Bank Of New York and Eqcc Trust 2001-2
Purchase Details
Closed on
Dec 26, 1998
Sold by
Paul Hughes Donald and Paul Sharon R
Bought by
Hughes Sharon R
Home Financials for this Owner
Home Financials are based on the most recent Mortgage that was taken out on this home.
Original Mortgage
$58,875
Interest Rate
11.5%
Create a Home Valuation Report for This Property
The Home Valuation Report is an in-depth analysis detailing your home's value as well as a comparison with similar homes in the area
Home Values in the Area
Average Home Value in this Area
Purchase History
| Date | Buyer | Sale Price | Title Company |
|---|---|---|---|
| Young Lonnie | $104,025 | None Available | |
| Young Early | $109,500 | -- | |
| The Bank Of New York | $66,032 | -- | |
| Hughes Sharon R | -- | -- |
Source: Public Records
Mortgage History
| Date | Status | Borrower | Loan Amount |
|---|---|---|---|
| Previous Owner | Young Early | $104,025 | |
| Previous Owner | Hughes Sharon R | $58,875 | |
| Closed | The Bank Of New York | -- |
Source: Public Records
Tax History Compared to Growth
Tax History
| Year | Tax Paid | Tax Assessment Tax Assessment Total Assessment is a certain percentage of the fair market value that is determined by local assessors to be the total taxable value of land and additions on the property. | Land | Improvement |
|---|---|---|---|---|
| 2025 | $2,408 | $29,170 | $4,220 | $24,950 |
| 2024 | $2,408 | $26,590 | $2,930 | $23,660 |
| 2023 | $2,400 | $26,590 | $2,930 | $23,660 |
| 2022 | $1,968 | $19,360 | $5,490 | $13,870 |
| 2021 | $1,863 | $19,360 | $5,490 | $13,870 |
| 2020 | $1,767 | $17,100 | $3,290 | $13,810 |
| 2019 | $1,753 | $17,100 | $3,290 | $13,810 |
| 2018 | $1,653 | $14,890 | $1,860 | $13,030 |
| 2017 | $1,651 | $14,890 | $1,860 | $13,030 |
| 2016 | $1,838 | $16,340 | $2,620 | $13,720 |
| 2015 | $1,797 | $16,340 | $2,620 | $13,720 |
| 2014 | $1,964 | $17,810 | $3,330 | $14,480 |
Source: Public Records
Map
Nearby Homes
- 12095 El Camara Dr
- 12136 La Padera Ln
- 12065 El Camara Dr
- 6250 Pennyrich Ct
- 12320 Missile Ln
- 11760 Sheffield Dr
- 11774 El Somo Ct
- 6530 Farm Pond Ct
- 12292 Jerries Ln
- 11951 Jerries Ln
- 6480 Hadden Bay Dr
- 5432 Trailbend Dr
- 5348 Trailoaks Dr
- 12455 Jerries Ln
- 6320 Hadden Bay Dr
- 5372 Trailbend Dr
- 11757 Vizcuya Ct
- 5239 Trailoaks Dr
- 6587 Dolphin Cir E Unit 110B
- 6595 Dolphin Cir E Unit 131A
- 6174 Red Wagon Ct
- 12128 El Camara Dr
- 12118 El Camara Dr
- 6315 Coventry Dr
- 12127 La Padera Ln
- 6124 Red Wagon Ct
- 12117 La Padera Ln
- 6321 Coventry Dr
- 6175 Red Wagon Ct
- 6309 Coventry Dr
- 12147 La Padera Ln
- 6155 Red Wagon Ct
- 12115 La Padera Ln
- 6327 Coventry Dr
- 6135 Red Wagon Ct
- 12129 El Camara Dr
- 6084 Red Wagon Ct
- 12116 La Padera Ln
- 6308 Coventry Dr
- 6160 Pennyrich Ct