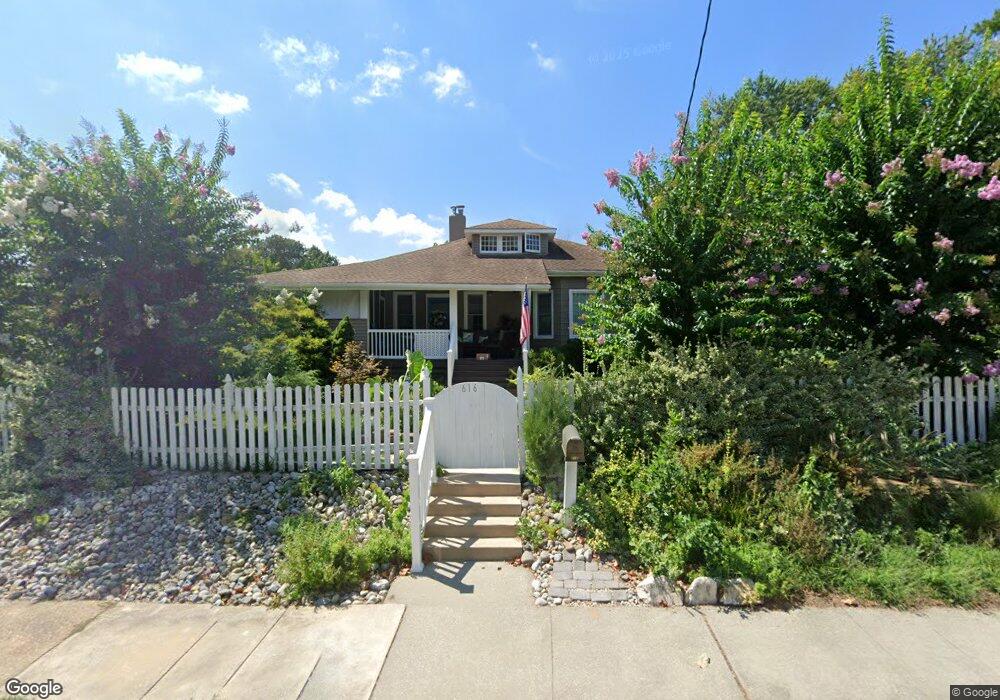
616 Cedar Ave Pitman, NJ 08071
Estimated Value: $369,708 - $522,000
3
Beds
1
Bath
1,595
Sq Ft
$265/Sq Ft
Est. Value
About This Home
This home is located at 616 Cedar Ave, Pitman, NJ 08071 and is currently estimated at $422,177, approximately $264 per square foot. 616 Cedar Ave is a home located in Gloucester County with nearby schools including W.C.K. Walls Elementary School, Pitman Middle School, and Pitman High School.
Ownership History
Date
Name
Owned For
Owner Type
Purchase Details
Closed on
Oct 24, 2008
Sold by
Neilio Randi and Estate Of Nicholas Neilio Jr
Bought by
Suhoskey Jane
Current Estimated Value
Home Financials for this Owner
Home Financials are based on the most recent Mortgage that was taken out on this home.
Original Mortgage
$173,627
Outstanding Balance
$112,080
Interest Rate
5.83%
Mortgage Type
FHA
Estimated Equity
$310,097
Create a Home Valuation Report for This Property
The Home Valuation Report is an in-depth analysis detailing your home's value as well as a comparison with similar homes in the area
Home Values in the Area
Average Home Value in this Area
Purchase History
| Date | Buyer | Sale Price | Title Company |
|---|---|---|---|
| Suhoskey Jane | $175,000 | Foundation Title Llc |
Source: Public Records
Mortgage History
| Date | Status | Borrower | Loan Amount |
|---|---|---|---|
| Open | Suhoskey Jane | $173,627 |
Source: Public Records
Tax History
| Year | Tax Paid | Tax Assessment Tax Assessment Total Assessment is a certain percentage of the fair market value that is determined by local assessors to be the total taxable value of land and additions on the property. | Land | Improvement |
|---|---|---|---|---|
| 2025 | $8,471 | $242,500 | $66,500 | $176,000 |
| 2024 | $8,247 | $242,500 | $66,500 | $176,000 |
| 2023 | $8,247 | $242,500 | $66,500 | $176,000 |
| 2022 | $7,922 | $242,500 | $66,500 | $176,000 |
| 2021 | $8,361 | $186,500 | $58,500 | $128,000 |
| 2020 | $8,262 | $186,500 | $58,500 | $128,000 |
| 2019 | $8,068 | $186,500 | $58,500 | $128,000 |
| 2018 | $7,932 | $186,500 | $58,500 | $128,000 |
| 2017 | $7,833 | $186,500 | $58,500 | $128,000 |
| 2016 | $7,682 | $186,500 | $58,500 | $128,000 |
| 2015 | $7,475 | $186,500 | $58,500 | $128,000 |
| 2014 | $7,246 | $186,500 | $58,500 | $128,000 |
Source: Public Records
Map
Nearby Homes
- 407 Tuohy Ave
- 198 West Ave
- 1300 Cedar Ave
- 135 Laurel Ave
- 142 2nd Ave
- 315 Lake Ave
- 349 W Jersey Ave
- 14 4th Ave
- 127 W Holly Ave
- 1040 N Main St
- 205 Adams Ave
- 508 Hudson Ave
- 302 Montgomery Ave
- 740 Carpenter St
- 237 Adams Ave
- 344 Columbia Ave
- 603 Hudson Ave
- 103 N Brentwood Ave
- 0 Lambs Rd Unit NJGL2048944
- 30 N Woodbury Rd
Your Personal Tour Guide
Ask me questions while you tour the home.