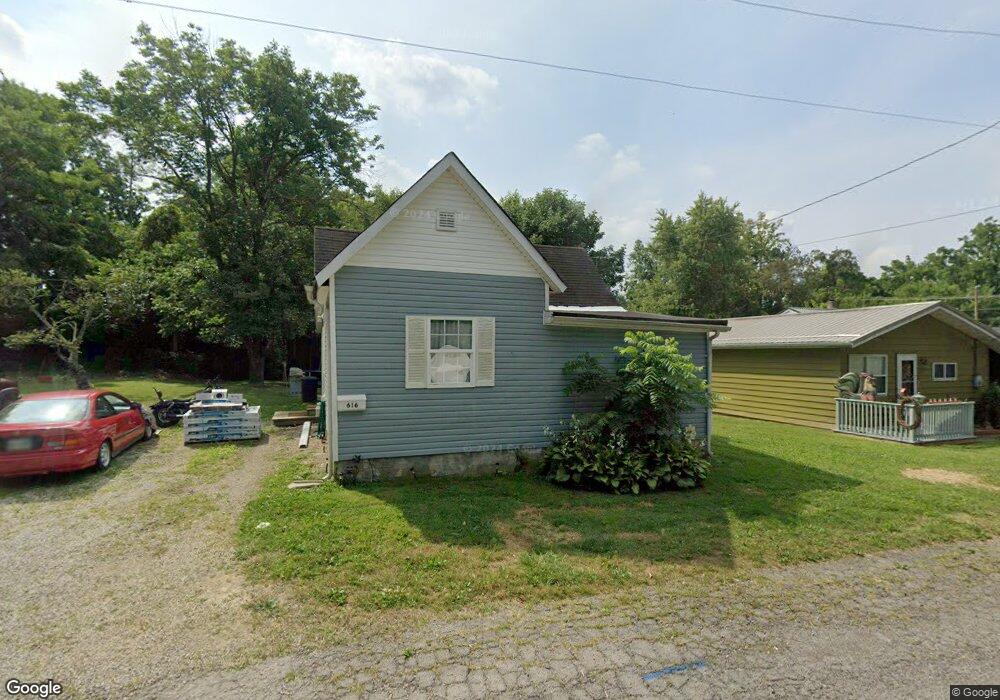
616 E Johns St Blanchester, OH 45107
Estimated Value: $146,000 - $189,000
3
Beds
1
Bath
864
Sq Ft
$188/Sq Ft
Est. Value
About This Home
This home is located at 616 E Johns St, Blanchester, OH 45107 and is currently estimated at $162,067, approximately $187 per square foot. 616 E Johns St is a home located in Clinton County with nearby schools including Putman Elementary School, Blanchester Middle School, and Blanchester High School.
Ownership History
Date
Name
Owned For
Owner Type
Purchase Details
Closed on
Jan 10, 2007
Sold by
Hud
Bought by
Jr General Properties Llc
Current Estimated Value
Purchase Details
Closed on
Jan 18, 2006
Sold by
Fisher Sheila L
Bought by
Hud
Purchase Details
Closed on
Nov 1, 2005
Sold by
Fisher Sheila L
Bought by
Hud
Purchase Details
Closed on
Aug 2, 2004
Sold by
Fisher Bryan D and Fisher Sheila L
Bought by
Fisher Sheila L
Home Financials for this Owner
Home Financials are based on the most recent Mortgage that was taken out on this home.
Original Mortgage
$52,780
Interest Rate
6.4%
Mortgage Type
FHA
Purchase Details
Closed on
Jun 10, 2004
Sold by
Fisher Bryan D
Bought by
Fisher Sheila L
Home Financials for this Owner
Home Financials are based on the most recent Mortgage that was taken out on this home.
Original Mortgage
$52,780
Interest Rate
6.4%
Mortgage Type
FHA
Purchase Details
Closed on
Jun 16, 1995
Bought by
Fisher Bryan D
Create a Home Valuation Report for This Property
The Home Valuation Report is an in-depth analysis detailing your home's value as well as a comparison with similar homes in the area
Home Values in the Area
Average Home Value in this Area
Purchase History
| Date | Buyer | Sale Price | Title Company |
|---|---|---|---|
| Jr General Properties Llc | -- | -- | |
| Hud | -- | -- | |
| Hud | $50,000 | None Available | |
| Fisher Sheila L | -- | -- | |
| Fisher Sheila L | -- | -- | |
| Fisher Bryan D | $50,000 | -- |
Source: Public Records
Mortgage History
| Date | Status | Borrower | Loan Amount |
|---|---|---|---|
| Previous Owner | Fisher Sheila L | $52,780 |
Source: Public Records
Tax History
| Year | Tax Paid | Tax Assessment Tax Assessment Total Assessment is a certain percentage of the fair market value that is determined by local assessors to be the total taxable value of land and additions on the property. | Land | Improvement |
|---|---|---|---|---|
| 2025 | $1,286 | $35,630 | $4,270 | $31,360 |
| 2024 | $1,286 | $35,630 | $4,270 | $31,360 |
| 2023 | $1,365 | $35,630 | $4,270 | $31,360 |
| 2022 | $1,119 | $26,480 | $3,690 | $22,790 |
| 2021 | $1,174 | $22,620 | $3,690 | $18,930 |
| 2020 | $1,000 | $22,620 | $3,690 | $18,930 |
| 2019 | $855 | $18,700 | $3,690 | $15,010 |
| 2018 | $858 | $18,700 | $3,690 | $15,010 |
| 2017 | $841 | $18,700 | $3,690 | $15,010 |
| 2016 | $654 | $15,210 | $3,690 | $11,520 |
| 2015 | $654 | $15,210 | $3,690 | $11,520 |
| 2013 | $649 | $14,650 | $3,690 | $10,960 |
Source: Public Records
Map
Nearby Homes
- 501 E Johns St
- 816 E Center St
- 305 E Main St
- 60 S Orchard Cir
- 9 Pansy Pike
- 11 Pansy Pike
- 12 Pansy Pike
- 10 Pansy Pike
- 203 E Main St
- 157 Pansy Pike
- 117 Pansy Pike
- 1 Middleboro Rd
- 213 N Broadway St
- 308 S Broadway St
- 125 W Fancy St
- 503 S Broadway St
- 501 S Wright St
- 502 Railroad St
- 143 W Fancy St
- 0 Ohio 123 Unit 11 938995
- 614 E Johns St
- 612 E Johns St
- 610 E Johns St
- 610 E John St
- 312 North St
- 611 E Baldwin St
- 314 E North St
- 607 E Baldwin St
- 611 E Johns St
- 316 N Supinger Ave
- 603 E Baldwin St
- 314 North St
- 601 E Johns St
- 601 E Baldwin St
- 516 E Johns St
- 515 E Baldwin St
- 513 E Johns St
- 512 E Johns St
- 612 E Baldwin St
- 610 E Baldwin St
Your Personal Tour Guide
Ask me questions while you tour the home.