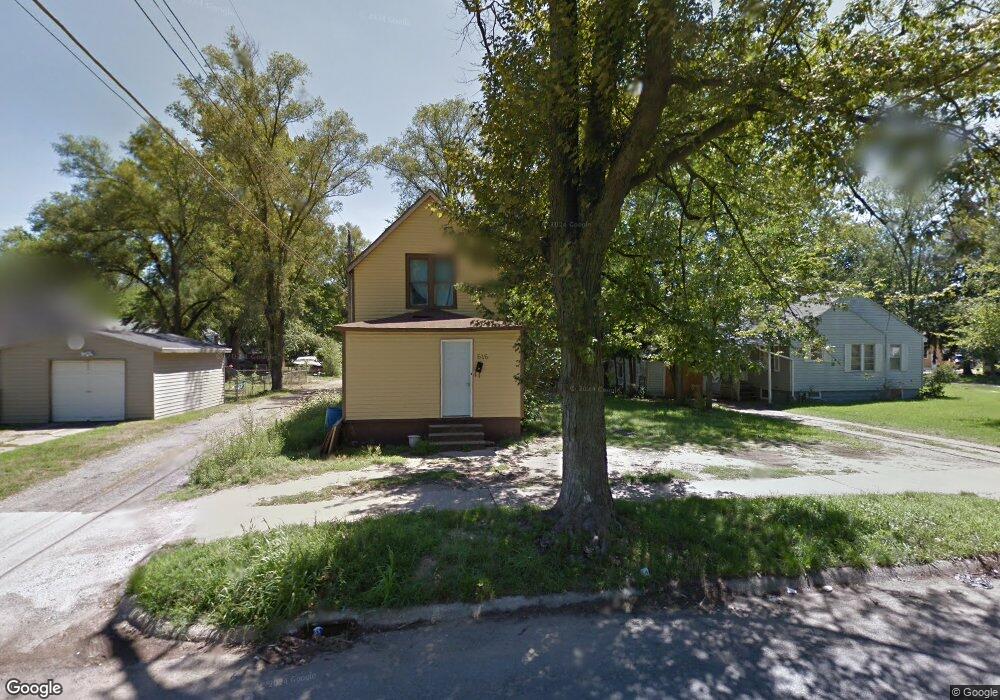
616 E May St Benton Harbor, MI 49022
Estimated Value: $87,357 - $113,000
4
Beds
1
Bath
614
Sq Ft
$161/Sq Ft
Est. Value
About This Home
This home is located at 616 E May St, Benton Harbor, MI 49022 and is currently estimated at $99,089, approximately $161 per square foot. 616 E May St is a home located in Berrien County with nearby schools including Fair Plain Middle School, Benton Harbor High School, and Mildred C. Wells Preparatory Academy.
Ownership History
Date
Name
Owned For
Owner Type
Purchase Details
Closed on
Sep 25, 2023
Sold by
Nichols Dekiah
Bought by
Martinez Salvador Mendoza Guad
Current Estimated Value
Purchase Details
Closed on
May 4, 2022
Sold by
Cohn Larry
Bought by
Nichols Dekiah
Purchase Details
Closed on
Jul 28, 2014
Sold by
Berrien County Treasurer
Bought by
Cohn Larry
Purchase Details
Closed on
Sep 16, 2008
Sold by
Witkowski Bret
Bought by
Cohn Larry
Purchase Details
Closed on
Feb 13, 2007
Sold by
Jdt Land Llc
Bought by
Samex Capital Partners Llc
Purchase Details
Closed on
Apr 30, 2004
Sold by
Lechenet Randall Lee and Lechenet Mary D
Bought by
Bloom Properties Inc
Purchase Details
Closed on
Dec 11, 2003
Sold by
Lechenet Mary D and Lechenet Randall Lee
Bought by
Chemical Bank Shoreline and Shoreline Bank
Purchase Details
Closed on
Sep 28, 1999
Purchase Details
Closed on
Jan 25, 1990
Purchase Details
Closed on
Apr 21, 1981
Purchase Details
Closed on
Aug 6, 1979
Create a Home Valuation Report for This Property
The Home Valuation Report is an in-depth analysis detailing your home's value as well as a comparison with similar homes in the area
Home Values in the Area
Average Home Value in this Area
Purchase History
| Date | Buyer | Sale Price | Title Company |
|---|---|---|---|
| Martinez Salvador Mendoza Guad | -- | None Listed On Document | |
| Martinez Salvador Mendoza Guad | -- | None Listed On Document | |
| Nichols Dekiah | -- | None Listed On Document | |
| Cohn Larry | $4,928 | None Available | |
| Cohn Larry | $3,500 | None Available | |
| Samex Capital Partners Llc | -- | None Available | |
| Bloom Properties Inc | -- | Chicago Title | |
| Chemical Bank Shoreline | $29,444 | -- | |
| -- | -- | -- | |
| -- | -- | -- | |
| -- | $3,300 | -- | |
| -- | $3,300 | -- |
Source: Public Records
Tax History Compared to Growth
Tax History
| Year | Tax Paid | Tax Assessment Tax Assessment Total Assessment is a certain percentage of the fair market value that is determined by local assessors to be the total taxable value of land and additions on the property. | Land | Improvement |
|---|---|---|---|---|
| 2025 | $2,311 | $17,900 | $0 | $0 |
| 2024 | $935 | $15,500 | $0 | $0 |
| 2023 | $527 | $10,400 | $0 | $0 |
| 2022 | $459 | $7,600 | $0 | $0 |
| 2021 | $559 | $9,200 | $600 | $8,600 |
| 2020 | $797 | $9,200 | $0 | $0 |
| 2019 | $847 | $8,000 | $0 | $0 |
| 2018 | $905 | $7,600 | $0 | $0 |
| 2017 | $1,228 | $13,200 | $0 | $0 |
| 2016 | $901 | $13,300 | $0 | $0 |
| 2015 | $843 | $12,800 | $0 | $0 |
| 2014 | $866 | $15,500 | $0 | $0 |
Source: Public Records
Map
Nearby Homes
- 1129 Jennings Ave
- 960 Union Ave
- 1219 Ogden Ave
- 960 Jennings Ave
- 361 E May St
- 1301 Superior St
- 1097 Pearl St
- 1337 Agard Ave
- 1332 Columbus Ave
- 972 Pearl St
- 1267 Broadway
- 1380 Milton St
- 349 E Empire Ave
- 833 Pearl St
- 0 V/L E Empire Ave
- 730 Superior St
- 1045 Broadway
- 1591 Union Ave
- 979 Lavette Ave
- 180 Emery Ave
- 1111 Jennings Ave
- 1110 Bishop Ave
- 1120 Bishop Ave
- 1133 Jennings Ave
- 1126 Bishop Ave
- 1095 Jennings Ave
- 1092 Bishop Ave
- 1139 Jennings Ave
- 1134 Bishop Ave
- 1085 Jennings Ave
- 1145 Jennings Ave
- 1110 Jennings Ave
- 1081 Jennings Ave
- 1122 Jennings Ave
- 1094 Jennings Ave
- 1142 Bishop Ave
- 1086 Bishop Ave
- 1086 Jennings Ave
- 1151 Jennings Ave
- 1073 Jennings Ave