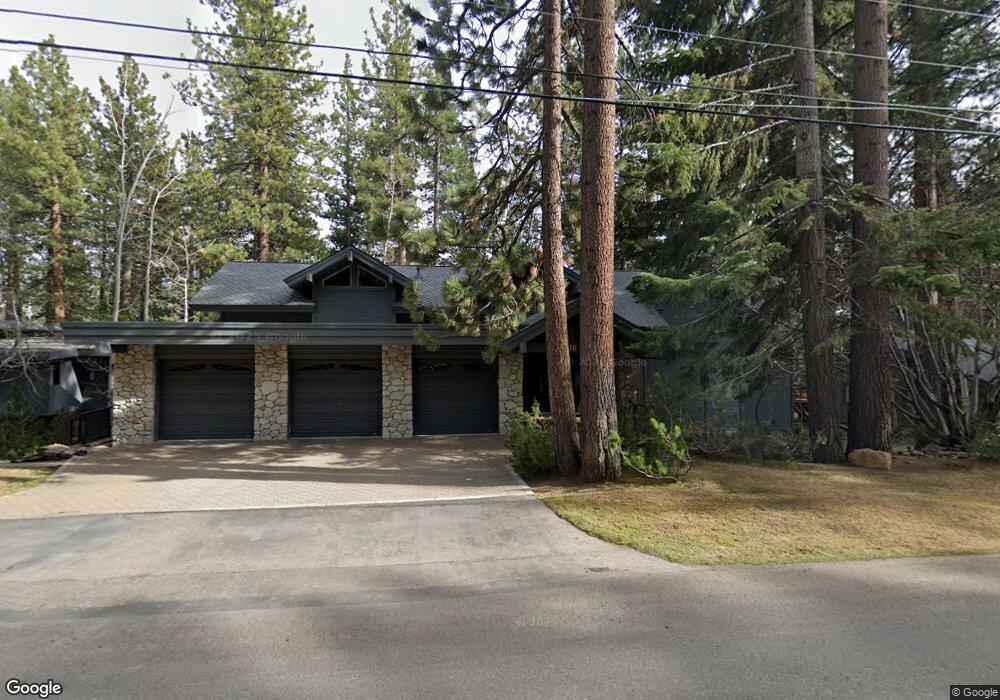
616 Fourteenth Green Incline Village, NV 89451
Estimated Value: $1,799,000 - $9,239,000
6
Beds
7
Baths
7,126
Sq Ft
$850/Sq Ft
Est. Value
About This Home
This home is located at 616 Fourteenth Green, Incline Village, NV 89451 and is currently estimated at $6,057,129, approximately $850 per square foot. 616 Fourteenth Green is a home located in Washoe County with nearby schools including Incline Elementary School, Incline Middle School, and Incline High School.
Ownership History
Date
Name
Owned For
Owner Type
Purchase Details
Closed on
Aug 1, 2003
Sold by
Kirkorian Kent and Kirkorian Marleen
Bought by
Moore Steven R and Moore Kathleen
Current Estimated Value
Home Financials for this Owner
Home Financials are based on the most recent Mortgage that was taken out on this home.
Original Mortgage
$500,000
Outstanding Balance
$206,188
Interest Rate
4.75%
Mortgage Type
Unknown
Estimated Equity
$5,850,941
Purchase Details
Closed on
Apr 14, 1997
Sold by
Jmk Partnership
Bought by
Kirkorian Kent and Kirkorian Marleen
Home Financials for this Owner
Home Financials are based on the most recent Mortgage that was taken out on this home.
Original Mortgage
$1,200,000
Interest Rate
7.12%
Purchase Details
Closed on
Mar 14, 1996
Sold by
Rossbach Mcgivern Jo Ann
Bought by
Jmk Partnership
Create a Home Valuation Report for This Property
The Home Valuation Report is an in-depth analysis detailing your home's value as well as a comparison with similar homes in the area
Home Values in the Area
Average Home Value in this Area
Purchase History
| Date | Buyer | Sale Price | Title Company |
|---|---|---|---|
| Moore Steven R | $2,850,000 | Stewart Title Of Northern Nv | |
| Kirkorian Kent | $1,500,000 | First American Title Co | |
| Jmk Partnership | $625,000 | First American Title Co | |
| Rossbach Mcgivern Jo Ann | -- | First American Title Co |
Source: Public Records
Mortgage History
| Date | Status | Borrower | Loan Amount |
|---|---|---|---|
| Open | Moore Steven R | $500,000 | |
| Previous Owner | Kirkorian Kent | $1,200,000 |
Source: Public Records
Tax History Compared to Growth
Tax History
| Year | Tax Paid | Tax Assessment Tax Assessment Total Assessment is a certain percentage of the fair market value that is determined by local assessors to be the total taxable value of land and additions on the property. | Land | Improvement |
|---|---|---|---|---|
| 2025 | $29,932 | $961,931 | $283,500 | $678,431 |
| 2024 | $29,932 | $954,044 | $267,750 | $686,294 |
| 2023 | $29,079 | $903,302 | $252,000 | $651,302 |
| 2022 | $28,570 | $799,017 | $220,500 | $578,517 |
| 2021 | $27,761 | $775,044 | $204,750 | $570,294 |
| 2020 | $27,605 | $769,556 | $204,750 | $564,806 |
| 2019 | $27,694 | $777,311 | $204,750 | $572,561 |
| 2018 | $28,859 | $812,043 | $227,500 | $584,543 |
| 2017 | $28,204 | $794,651 | $210,000 | $584,651 |
| 2016 | $27,510 | $778,615 | $192,500 | $586,115 |
| 2015 | $20,593 | $787,317 | $192,500 | $594,817 |
| 2014 | $26,681 | $750,403 | $192,500 | $557,903 |
| 2013 | -- | $742,464 | $175,000 | $567,464 |
Source: Public Records
Map
Nearby Homes
- 585 Village Blvd
- 886 Rosewood Cir
- 647 Village Blvd Unit 3
- 976 Caddie Ct
- 779 Rosewood Cir
- 887 S Dyer Cir
- 908 Harold Dr Unit 23
- 908 Harold Dr Unit 18
- 908 Harold Dr Unit 38
- 898 Peepsight Cir Unit 27B
- 893 Donna Dr
- 881 Donna Dr
- 978 Glenrock Dr Unit 13
- 696 Village Blvd Unit 24
- 696 Village Blvd Unit 12
- 696 Village Blvd Unit 20
- 580 Lucille Dr
- 770 Golfers Pass Rd
- 579 Lucille Dr
- 740 Crosby Ct Unit 3
- 620 Fourteenth Green
- 612 Fourteenth Green
- 617 14th Green
- 617 Fourteenth Green
- 608 14th Green
- 621 Fourteenth Green
- 624 14th Green
- 624 Garen St
- 624 Fourteenth Green
- 629 Fourteenth Green
- 906 Ace Ct
- 615 Garen St
- 615 Fourteenth Green
- 604 Fourteenth Green
- 612 Village Blvd
- 600 Village Blvd
- 630 Fourteenth Green
- 630 Garen St
- 626 Village Blvd
- 633 14th Green