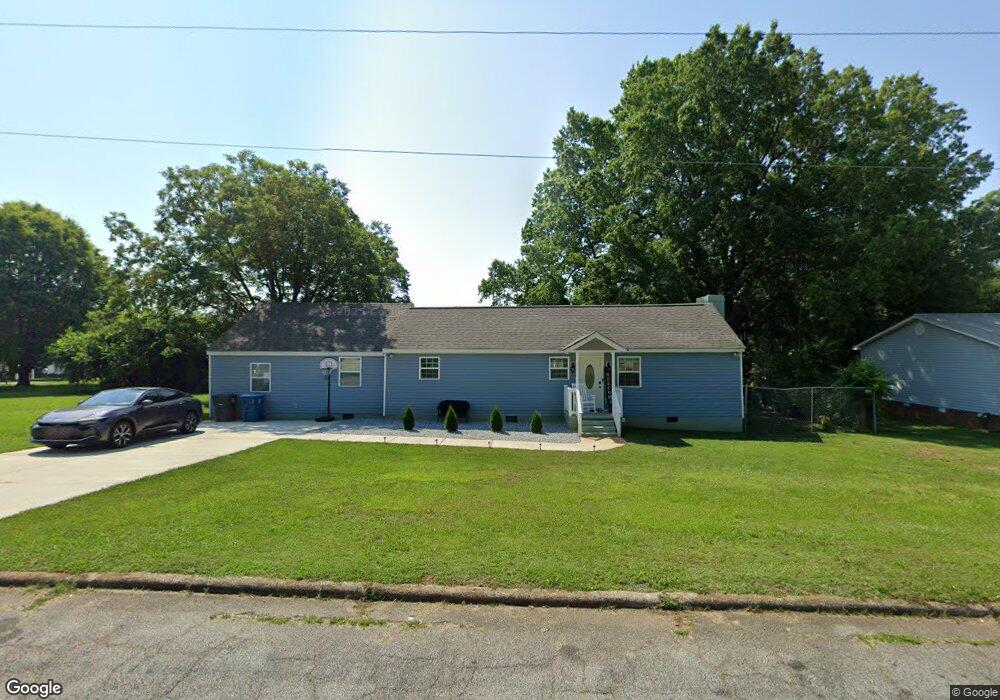
616 Green St Unit 1 Salisbury, NC 28144
Estimated Value: $262,000 - $309,000
4
Beds
3
Baths
1,692
Sq Ft
$173/Sq Ft
Est. Value
About This Home
This home is located at 616 Green St Unit 1, Salisbury, NC 28144 and is currently estimated at $292,542, approximately $172 per square foot. 616 Green St Unit 1 is a home located in Rowan County with nearby schools including Elizabeth Duncan Koontz Elementary School, North Rowan Middle School, and Salisbury High School.
Ownership History
Date
Name
Owned For
Owner Type
Purchase Details
Closed on
Mar 16, 2022
Sold by
Vasquez Blanco Daniel
Bought by
Mccray Ebony Leishia and Koontz Derrick
Current Estimated Value
Home Financials for this Owner
Home Financials are based on the most recent Mortgage that was taken out on this home.
Original Mortgage
$254,308
Outstanding Balance
$237,417
Interest Rate
3.85%
Mortgage Type
FHA
Estimated Equity
$55,125
Purchase Details
Closed on
Jul 29, 2021
Sold by
Flores Juan Santiago
Bought by
Blanco Daniel Vasquez
Purchase Details
Closed on
Jul 24, 2020
Sold by
Duke John H and Duke Linda T
Bought by
Flores Juan Santiago
Purchase Details
Closed on
Jan 31, 2012
Sold by
Duke Linda M and Duke John H
Bought by
The John H Duke And Linda M Duke Irrevoc
Create a Home Valuation Report for This Property
The Home Valuation Report is an in-depth analysis detailing your home's value as well as a comparison with similar homes in the area
Home Values in the Area
Average Home Value in this Area
Purchase History
| Date | Buyer | Sale Price | Title Company |
|---|---|---|---|
| Mccray Ebony Leishia | $259,000 | Johannesmeyer & Sawyer Pllc | |
| Blanco Daniel Vasquez | $42,000 | South City Title | |
| Flores Juan Santiago | $20,000 | None Available | |
| The John H Duke And Linda M Duke Irrevoc | -- | None Available |
Source: Public Records
Mortgage History
| Date | Status | Borrower | Loan Amount |
|---|---|---|---|
| Open | Mccray Ebony Leishia | $254,308 |
Source: Public Records
Tax History
| Year | Tax Paid | Tax Assessment Tax Assessment Total Assessment is a certain percentage of the fair market value that is determined by local assessors to be the total taxable value of land and additions on the property. | Land | Improvement |
|---|---|---|---|---|
| 2025 | $3,056 | $255,546 | $28,449 | $227,097 |
| 2024 | $3,056 | $255,546 | $28,449 | $227,097 |
| 2023 | $3,056 | $255,546 | $28,449 | $227,097 |
| 2022 | $1,049 | $76,145 | $21,582 | $54,563 |
| 2021 | $1,049 | $76,145 | $21,582 | $54,563 |
| 2020 | $1,049 | $76,145 | $21,582 | $54,563 |
| 2019 | $1,049 | $76,145 | $21,582 | $54,563 |
| 2018 | $912 | $67,155 | $21,582 | $45,573 |
| 2017 | $908 | $67,155 | $21,582 | $45,573 |
| 2016 | $883 | $67,155 | $21,582 | $45,573 |
| 2015 | $888 | $67,155 | $21,582 | $45,573 |
| 2014 | $914 | $69,923 | $22,072 | $47,851 |
Source: Public Records
Map
Nearby Homes
- 628 E Lafayette St
- 915 Reeves St
- 505 E Cemetery St
- 215 Green St
- 613 E Liberty St
- 205 N Martin Luther King jr Ave
- 510 Fairbluff Ave
- 0 Skyline Dr
- 500 W Council St
- 000 Bringle Ferry Rd
- 1138 Laurel St
- 224 E Steele St
- 1102 Grady St
- 1270 N Shaver St
- 1280 N Shaver St
- 115 E Steele St
- 1121 Richard St
- 1214 Short St
- 1129 Kenly St
- 0 Brown St
- 616 Green St
- 731 E Lafayette St
- 607 Green St
- 817 E Lafayette St
- 810 E Franklin St
- 804 E Franklin St
- 810 E Lafayette St
- 816 E Franklin St
- 812 E Lafayette St
- 820 E Lafayette St
- 720 E Franklin St
- Lot 1 Green St
- 724 E Franklin St
- 716 E Franklin St
- 824 E Lafayette St
- 803 Reeves St
- 631 N Martin Luther King jr Ave
- 807 Reeves St Unit A
- 807 Reeves St Unit B
- 807 Reeves St
Your Personal Tour Guide
Ask me questions while you tour the home.