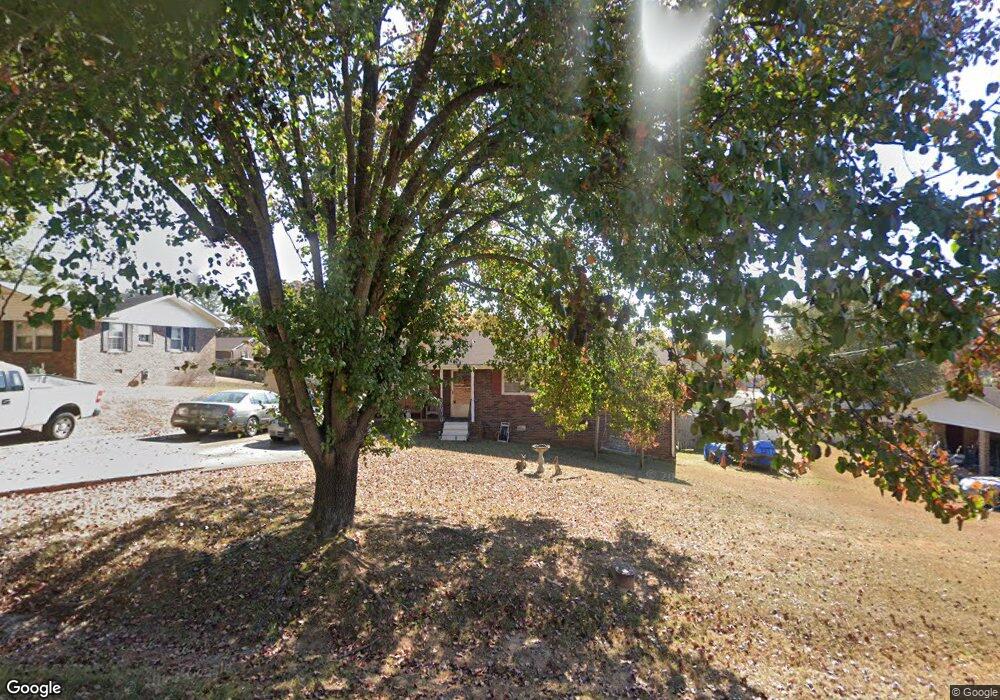
616 Hillside Dr Cedartown, GA 30125
Estimated Value: $217,000 - $242,000
3
Beds
2
Baths
1,384
Sq Ft
$163/Sq Ft
Est. Value
About This Home
This home is located at 616 Hillside Dr, Cedartown, GA 30125 and is currently estimated at $225,451, approximately $162 per square foot. 616 Hillside Dr is a home located in Polk County with nearby schools including Cedar Christian School and Vineyard Harvester Christian Academy.
Ownership History
Date
Name
Owned For
Owner Type
Purchase Details
Closed on
Jan 23, 2003
Sold by
Lockridge Preston Lee
Bought by
Lockridge Preston Lee and Wendy Elain
Current Estimated Value
Purchase Details
Closed on
Mar 29, 2002
Sold by
Secretary Of Housing And Urban Developme
Bought by
Lockridge Preston Lee
Purchase Details
Closed on
Jun 5, 2001
Sold by
First Horizon Home Loan Corp
Bought by
Secretary Of Housing And Urban Developme
Purchase Details
Closed on
Aug 11, 2000
Sold by
Willingham David L and Willingham Rebecca P
Bought by
Carter Shayne
Purchase Details
Closed on
Mar 14, 1980
Sold by
Gentry Charles
Bought by
Willingham David L
Purchase Details
Closed on
Aug 31, 1979
Sold by
Croker James Billy
Bought by
Gentry Charles
Purchase Details
Closed on
Aug 1, 1979
Bought by
Croker James Billy
Create a Home Valuation Report for This Property
The Home Valuation Report is an in-depth analysis detailing your home's value as well as a comparison with similar homes in the area
Home Values in the Area
Average Home Value in this Area
Purchase History
| Date | Buyer | Sale Price | Title Company |
|---|---|---|---|
| Lockridge Preston Lee | -- | -- | |
| Lockridge Preston Lee | -- | -- | |
| Secretary Of Housing And Urban Developme | -- | -- | |
| First Horizon Home Loan Corporation | -- | -- | |
| Carter Shayne | $84,500 | -- | |
| Willingham David L | -- | -- | |
| Gentry Charles | -- | -- | |
| Croker James Billy | -- | -- | |
| Croker James Billy | -- | -- |
Source: Public Records
Tax History Compared to Growth
Tax History
| Year | Tax Paid | Tax Assessment Tax Assessment Total Assessment is a certain percentage of the fair market value that is determined by local assessors to be the total taxable value of land and additions on the property. | Land | Improvement |
|---|---|---|---|---|
| 2024 | $893 | $57,454 | $3,840 | $53,614 |
| 2023 | $628 | $39,841 | $3,840 | $36,001 |
| 2022 | $763 | $34,158 | $2,560 | $31,598 |
| 2021 | $773 | $34,158 | $2,560 | $31,598 |
| 2020 | $775 | $34,158 | $2,560 | $31,598 |
| 2019 | $813 | $32,257 | $2,788 | $29,469 |
| 2018 | $791 | $30,695 | $2,119 | $28,576 |
| 2017 | $781 | $30,695 | $2,119 | $28,576 |
| 2016 | $781 | $30,695 | $2,119 | $28,576 |
| 2015 | $786 | $30,787 | $2,119 | $28,668 |
| 2014 | $853 | $33,041 | $2,083 | $30,958 |
Source: Public Records
Map
Nearby Homes
- 662 Hillside Dr
- 645 Valley Rd
- 618 Valley Rd
- 660 Valley Rd
- 109 Perry St
- 1101 East Ave
- 77 Ben Dr W
- 292 Kimwood Dr
- 12 Breckenridge Dr
- 10 Woodglen Dr
- 362 Oakwood Dr
- 202 Ridgewood Rd
- 254 E Girard Ave
- 209 Ridgewood Rd
- 462 Oakwood Dr
- 812 Blanche Rd
- 0 Blanche Rd Unit 10609468
- 0 Blanche Rd Unit 7652978
- 537 Fletcher St
- 256 Cuzzort Rd
- 614 Hillside Dr
- 617 Hillside Dr
- 613 Hillside Dr
- 622 Hillside Dr
- 621 Hillside Dr
- 606 Hillside Dr
- 609 Woodland Rd
- 605 Woodland Rd
- 605 Hillside Dr
- 613 Woodland Rd
- 626 Hillside Dr
- 624 Collard Valley Rd
- 625 Hillside Dr
- 620 Collard Valley Rd
- 628 Collard Valley Rd Unit 7 PT8
- 628 Collard Valley Rd
- 628 Collard Valley Rd Unit 7, PT OF 8
- 131 Abner Dr
- 606 Woodland Rd
- 614 Collard Valley Rd