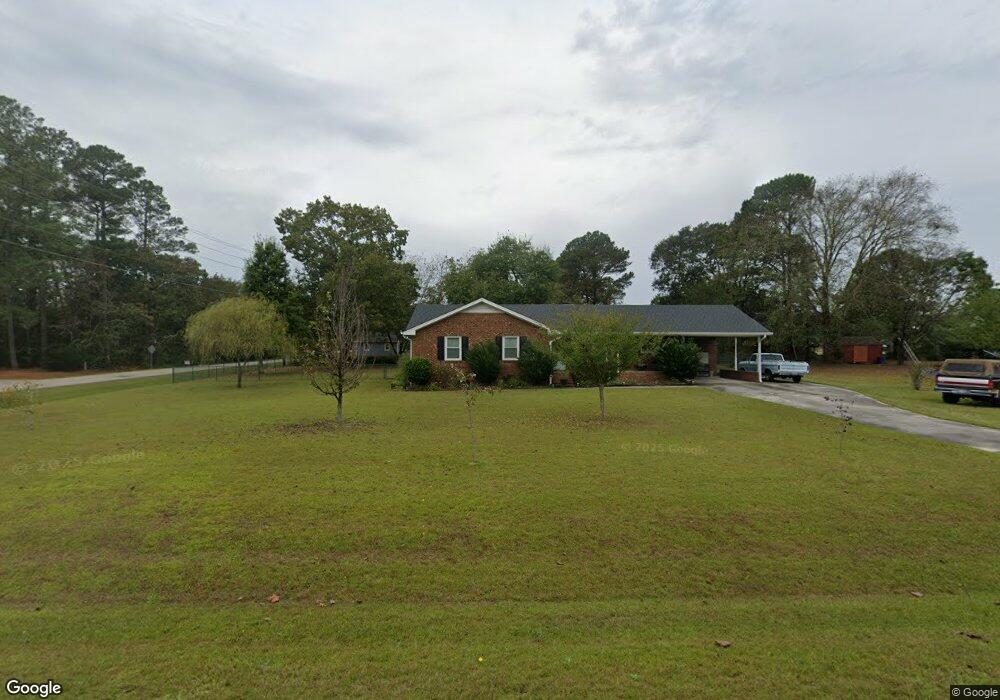
616 Lombardy Rd Fuquay Varina, NC 27526
Estimated Value: $394,000 - $422,000
3
Beds
2
Baths
1,910
Sq Ft
$214/Sq Ft
Est. Value
About This Home
This home is located at 616 Lombardy Rd, Fuquay Varina, NC 27526 and is currently estimated at $407,895, approximately $213 per square foot. 616 Lombardy Rd is a home located in Wake County with nearby schools including Fuquay-Varina High, Achievement Charter Academy, and Southern Wake Academy.
Ownership History
Date
Name
Owned For
Owner Type
Purchase Details
Closed on
Mar 28, 2014
Sold by
Morgan Bradley S and Morgan Ashley M
Bought by
Patterson Michael B and Patterson Megan B
Current Estimated Value
Home Financials for this Owner
Home Financials are based on the most recent Mortgage that was taken out on this home.
Original Mortgage
$151,920
Outstanding Balance
$115,575
Interest Rate
4.36%
Mortgage Type
New Conventional
Estimated Equity
$292,320
Purchase Details
Closed on
Aug 28, 2009
Sold by
The Estate Of Donald H Snodgrass and Snodgrass Kristin L
Bought by
Morgan Bradley S and Morgan Ashley H
Home Financials for this Owner
Home Financials are based on the most recent Mortgage that was taken out on this home.
Original Mortgage
$169,387
Interest Rate
5.11%
Mortgage Type
New Conventional
Create a Home Valuation Report for This Property
The Home Valuation Report is an in-depth analysis detailing your home's value as well as a comparison with similar homes in the area
Home Values in the Area
Average Home Value in this Area
Purchase History
| Date | Buyer | Sale Price | Title Company |
|---|---|---|---|
| Patterson Michael B | $190,000 | None Available | |
| Morgan Bradley S | $166,000 | Chicago Title Insurance Co |
Source: Public Records
Mortgage History
| Date | Status | Borrower | Loan Amount |
|---|---|---|---|
| Open | Patterson Michael B | $151,920 | |
| Previous Owner | Morgan Bradley S | $169,387 |
Source: Public Records
Tax History Compared to Growth
Tax History
| Year | Tax Paid | Tax Assessment Tax Assessment Total Assessment is a certain percentage of the fair market value that is determined by local assessors to be the total taxable value of land and additions on the property. | Land | Improvement |
|---|---|---|---|---|
| 2025 | $2,335 | $361,945 | $90,000 | $271,945 |
| 2024 | $2,268 | $361,945 | $90,000 | $271,945 |
| 2023 | $1,907 | $242,028 | $45,000 | $197,028 |
| 2022 | $1,768 | $242,028 | $45,000 | $197,028 |
| 2021 | $1,721 | $242,028 | $45,000 | $197,028 |
| 2020 | $1,696 | $242,028 | $45,000 | $197,028 |
| 2019 | $1,570 | $189,835 | $40,000 | $149,835 |
| 2018 | $1,445 | $189,835 | $40,000 | $149,835 |
| 2017 | $1,370 | $189,835 | $40,000 | $149,835 |
| 2016 | $1,342 | $189,835 | $40,000 | $149,835 |
| 2015 | $1,241 | $175,765 | $44,000 | $131,765 |
| 2014 | -- | $175,765 | $44,000 | $131,765 |
Source: Public Records
Map
Nearby Homes
- 2504 Fleming Rd
- 301 Brindle Dr
- McKimmon Plan at Holston
- Winston Plan at Holston
- Watauga Plan at Holston
- Biltmore Plan at Holston
- Nelson Plan at Holston
- Clark Plan at Holston
- Brooks Plan at Holston
- Mallard Plan at Holston
- 1800 Phelps Rd W
- 2340 Fleming Rd
- 2337 Fleming Rd
- 2341 Fleming Rd
- 2345 Fleming Rd
- 2301 Fleming Rd
- 6205 Caprine St
- 600 Far Post Dr
- 807 Crimson Ridge Trail
- 1900 Offside Ct
- 612 Lombardy Rd
- 2825 Piney Grove Wilbon Rd
- 2633 Fleming Rd
- 2821 Piney Grove Wilbon Rd
- 2629 Fleming Rd
- 621 Lombardy Rd
- 608 Lombardy Rd
- 617 Lombardy Rd
- 2817 Piney Grove Wilbon Rd
- 613 Lombardy Rd
- 607 Lombardy Rd
- 2621 Fleming Rd
- 2813 Piney Grove Wilbon Rd
- 604 Lombardy Rd
- 605 Lombardy Rd
- 2613 Fleming Rd
- 2612 Fleming Rd
- 2908 Piney Grove Wilbon Rd
- 2809 Piney Grove Wilbon Rd
- 2717 Knightwood Rd