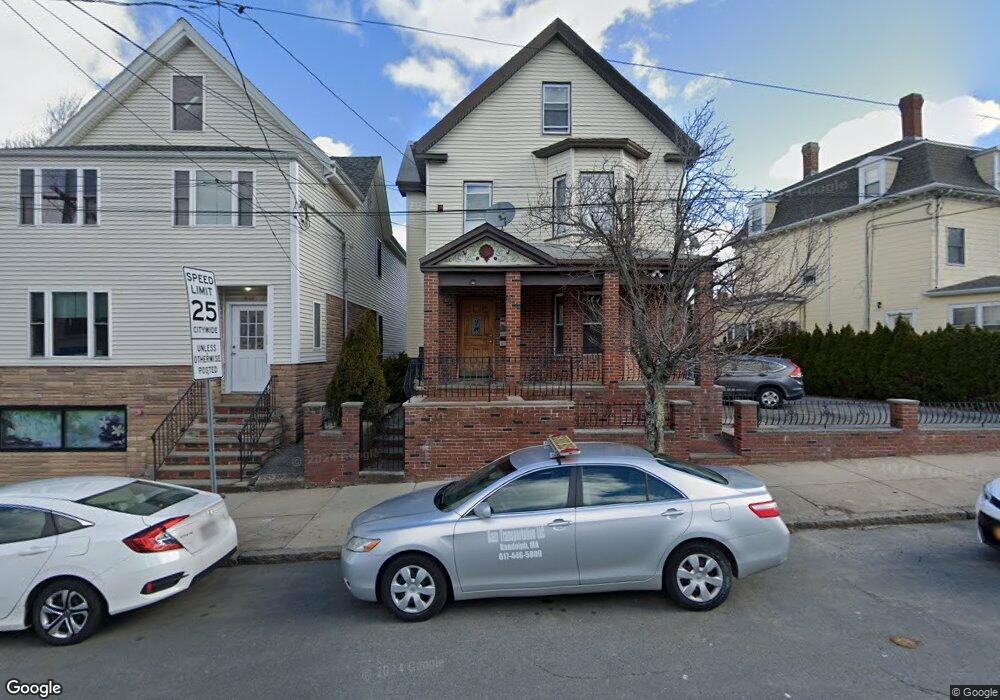
616 Main St Unit 3 Medford, MA 02155
South Medford NeighborhoodEstimated Value: $805,115 - $1,134,000
1
Bed
1
Bath
500
Sq Ft
$2,041/Sq Ft
Est. Value
About This Home
This home is located at 616 Main St Unit 3, Medford, MA 02155 and is currently estimated at $1,020,529, approximately $2,041 per square foot. 616 Main St Unit 3 is a home located in Middlesex County with nearby schools including Medford High School, St. Clement Elementary School, and Bright Future Educare Center.
Ownership History
Date
Name
Owned For
Owner Type
Purchase Details
Closed on
Oct 30, 2020
Sold by
Oliveira Manuel A and Oliveira Maria A
Bought by
Oliveira Holdings 4 Llc
Current Estimated Value
Purchase Details
Closed on
Oct 13, 2020
Sold by
Oliveira Holdings 4 Llc
Bought by
Oliveira Manuel A and Oliveira Maria A
Purchase Details
Closed on
May 11, 2018
Sold by
Oliveira Manuel A and Oliveira Maria A
Bought by
Oliveira Holdings 4 Ll
Purchase Details
Closed on
Aug 2, 1993
Sold by
Moscato Dorotea I and Moscato Charles I
Bought by
Oliveira Manuel A and Oliveira Maria A
Home Financials for this Owner
Home Financials are based on the most recent Mortgage that was taken out on this home.
Original Mortgage
$177,675
Interest Rate
7.32%
Mortgage Type
Purchase Money Mortgage
Create a Home Valuation Report for This Property
The Home Valuation Report is an in-depth analysis detailing your home's value as well as a comparison with similar homes in the area
Home Values in the Area
Average Home Value in this Area
Purchase History
| Date | Buyer | Sale Price | Title Company |
|---|---|---|---|
| Oliveira Holdings 4 Llc | -- | None Available | |
| Oliveira Manuel A | -- | None Available | |
| Oliveira Holdings 4 Ll | -- | -- | |
| Oliveira Manuel A | $192,500 | -- |
Source: Public Records
Mortgage History
| Date | Status | Borrower | Loan Amount |
|---|---|---|---|
| Previous Owner | Oliveira Manuel A | $50,000 | |
| Previous Owner | Oliveira Manuel A | $183,000 | |
| Previous Owner | Oliveira Manuel A | $177,675 | |
| Previous Owner | Oliveira Manuel A | $27,000 |
Source: Public Records
Tax History Compared to Growth
Tax History
| Year | Tax Paid | Tax Assessment Tax Assessment Total Assessment is a certain percentage of the fair market value that is determined by local assessors to be the total taxable value of land and additions on the property. | Land | Improvement |
|---|---|---|---|---|
| 2025 | $8,782 | $1,030,700 | $349,700 | $681,000 |
| 2024 | $8,782 | $1,030,700 | $349,700 | $681,000 |
| 2023 | $8,635 | $998,300 | $326,800 | $671,500 |
| 2022 | $8,727 | $968,600 | $297,100 | $671,500 |
| 2021 | $8,513 | $904,700 | $283,000 | $621,700 |
| 2020 | $8,152 | $888,000 | $283,000 | $605,000 |
| 2019 | $8,004 | $833,800 | $257,200 | $576,600 |
| 2018 | $7,811 | $762,800 | $233,800 | $529,000 |
| 2017 | $7,242 | $685,800 | $218,500 | $467,300 |
| 2016 | $6,867 | $613,700 | $198,700 | $415,000 |
| 2015 | $6,570 | $561,500 | $189,200 | $372,300 |
Source: Public Records
Map
Nearby Homes
- 37 Main St Unit 1
- 79 Partridge Ave
- 51 Edgar Ave
- 474 Broadway Unit 26
- 89 Heath St
- 25 Browning Rd
- 57 Edward St
- 496 Medford St
- 17 Bond St Unit 1
- 17 Bond St Unit 2
- 466 Medford St Unit 4
- 654 Mystic Ave
- 654 Mystic Ave Unit A
- 456 Medford St Unit 3
- 87 Medford St Unit 504
- 87 Medford St Unit 305
- 34 Fiske Ave Unit B
- 34 Fiske Ave Unit A
- 34 Fiske Ave Unit C
- 519 Broadway Unit 302