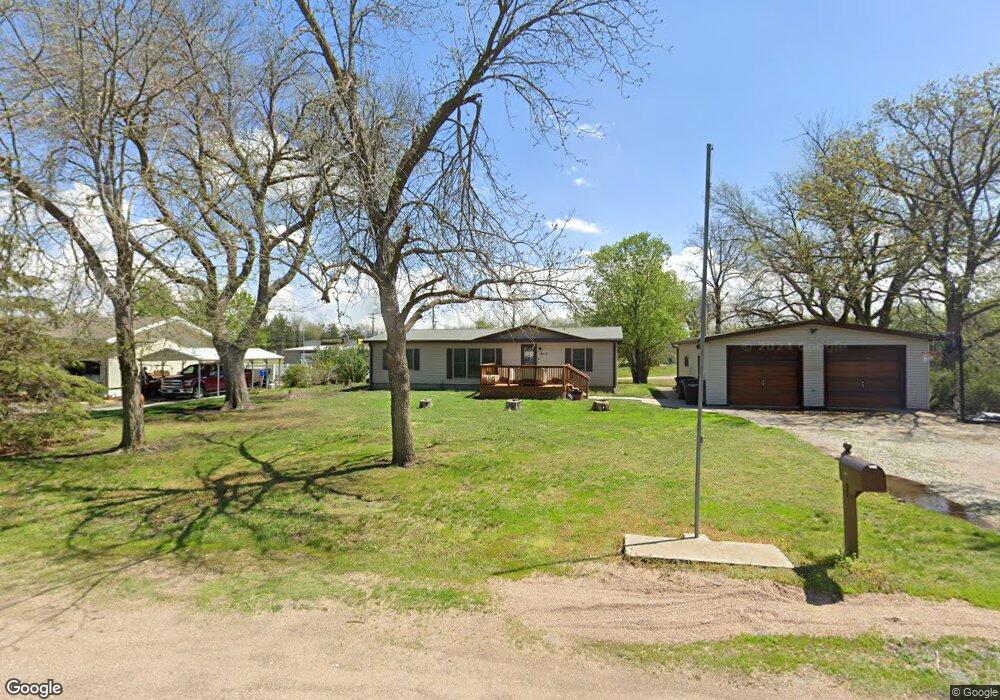
616 N Clay Ave Clay Center, NE 68933
Estimated Value: $134,000 - $177,000
3
Beds
2
Baths
1,568
Sq Ft
$101/Sq Ft
Est. Value
About This Home
This home is located at 616 N Clay Ave, Clay Center, NE 68933 and is currently estimated at $157,937, approximately $100 per square foot. 616 N Clay Ave is a home located in Clay County with nearby schools including Clay Center Elementary School.
Ownership History
Date
Name
Owned For
Owner Type
Purchase Details
Closed on
Sep 18, 2021
Sold by
Kimminau Paul A and Kimminau Stacy L
Bought by
Julich Sean P and Julich Jodi A
Current Estimated Value
Purchase Details
Closed on
Jun 22, 2015
Sold by
Kimminau Stacy L
Bought by
Kimminau Paul A
Purchase Details
Closed on
Nov 23, 2009
Sold by
Barkhoff Jennie L
Bought by
Kimminau Paul A and Kimminau Stacy L
Create a Home Valuation Report for This Property
The Home Valuation Report is an in-depth analysis detailing your home's value as well as a comparison with similar homes in the area
Home Values in the Area
Average Home Value in this Area
Purchase History
| Date | Buyer | Sale Price | Title Company |
|---|---|---|---|
| Julich Sean P | $98,986 | Baird & Griess | |
| Kimminau Paul A | -- | None Available | |
| Kimminau Paul A | -- | Adams Land Title |
Source: Public Records
Tax History Compared to Growth
Tax History
| Year | Tax Paid | Tax Assessment Tax Assessment Total Assessment is a certain percentage of the fair market value that is determined by local assessors to be the total taxable value of land and additions on the property. | Land | Improvement |
|---|---|---|---|---|
| 2024 | $1,896 | $149,325 | $11,530 | $137,795 |
| 2023 | $2,260 | $140,565 | $10,255 | $130,310 |
| 2022 | $1,939 | $104,480 | $4,240 | $100,240 |
| 2021 | $1,874 | $98,810 | $4,240 | $94,570 |
| 2020 | $1,828 | $95,345 | $4,240 | $91,105 |
| 2019 | $1,590 | $88,595 | $4,240 | $84,355 |
| 2018 | $1,591 | $88,595 | $4,240 | $84,355 |
| 2017 | $1,402 | $82,835 | $4,240 | $78,595 |
| 2016 | $1,517 | $82,835 | $4,240 | $78,595 |
| 2015 | $1,610 | $82,835 | $4,240 | $78,595 |
| 2014 | $1,778 | $82,835 | $4,240 | $78,595 |
| 2013 | $1,778 | $72,845 | $4,240 | $68,605 |
Source: Public Records
Map
Nearby Homes
- 510 N Clay Ave
- 120 Northridge Dr
- 108 W Glenvil St
- 510 W Willow St
- 416 W South St
- 0 Pheasant View Lots
- 31020 Road L County Rd
- 208 N Kearney Ave
- 405 E Maple Ave
- 401 N Adams Ave
- 408 N Harvard Ave
- 1580
- 1580 Road 320
- 401 Chestnut St
- 608 1st St
- 811 Grandview St
- 506 W Cedar St
- 507 S Maltby Ave
- 803 6th St
- 502 S Maltby Ave
- 622 N Clay Ave
- 610 N Clay Ave
- 305 E Harvey St
- 611 N Clay Ave
- 601 N Clay Ave
- 616 N Center St
- 604 N Center St
- 518 N Clay Ave
- 521 N Center St
- 135 Crooked Creek Cir
- 606 N Brown Ave
- 521 N Clay Ave
- 519 N Center St
- 101 Crooked Creek Cir
- 309 E Thurber St
- 513 N Center St
- 604 N Brown Ave
- 314 E Harvey St
- 313 E Thurber St
- 309 E Harvey St Unit 3