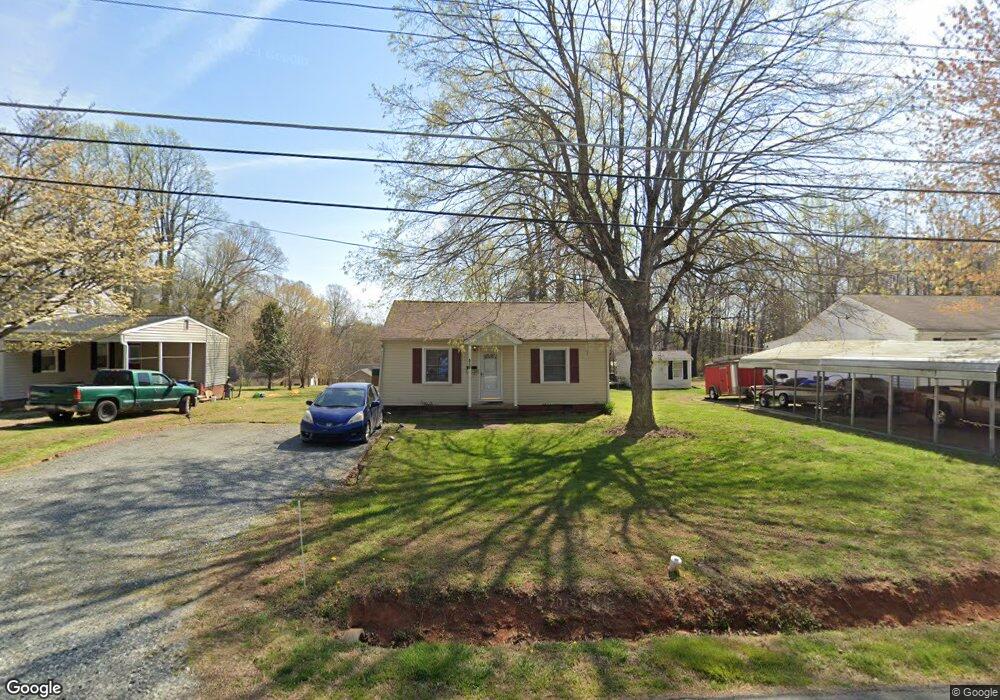
616 N Third St Mebane, NC 27302
Estimated Value: $183,000 - $260,000
2
Beds
1
Bath
1,010
Sq Ft
$226/Sq Ft
Est. Value
About This Home
This home is located at 616 N Third St, Mebane, NC 27302 and is currently estimated at $228,216, approximately $225 per square foot. 616 N Third St is a home located in Alamance County with nearby schools including E.M. Yoder Elementary School, Woodlawn Middle School, and Eastern Alamance High School.
Ownership History
Date
Name
Owned For
Owner Type
Purchase Details
Closed on
Oct 31, 2019
Sold by
The Estate Of Robert Scott Tickle
Bought by
Sunny Side Llc
Current Estimated Value
Home Financials for this Owner
Home Financials are based on the most recent Mortgage that was taken out on this home.
Original Mortgage
$122,000
Outstanding Balance
$107,541
Interest Rate
3.7%
Estimated Equity
$120,675
Purchase Details
Closed on
Oct 2, 2019
Sold by
Tickle Carol J
Bought by
Tickle Chris
Home Financials for this Owner
Home Financials are based on the most recent Mortgage that was taken out on this home.
Original Mortgage
$122,000
Outstanding Balance
$107,541
Interest Rate
3.7%
Estimated Equity
$120,675
Purchase Details
Closed on
Feb 22, 2012
Sold by
Hometown Homes Inc
Bought by
Tickle Robert S
Home Financials for this Owner
Home Financials are based on the most recent Mortgage that was taken out on this home.
Original Mortgage
$72,196
Interest Rate
3.87%
Mortgage Type
FHA
Purchase Details
Closed on
Jun 10, 2010
Sold by
Tibbs James
Bought by
Hometown Homes Inc
Create a Home Valuation Report for This Property
The Home Valuation Report is an in-depth analysis detailing your home's value as well as a comparison with similar homes in the area
Home Values in the Area
Average Home Value in this Area
Purchase History
| Date | Buyer | Sale Price | Title Company |
|---|---|---|---|
| Sunny Side Llc | $70,000 | Attorney | |
| Tickle Chris | -- | None Available | |
| Tickle Robert S | $75,000 | -- | |
| Hometown Homes Inc | $25,000 | -- |
Source: Public Records
Mortgage History
| Date | Status | Borrower | Loan Amount |
|---|---|---|---|
| Open | Sunny Side Llc | $122,000 | |
| Previous Owner | Tickle Robert S | $72,196 |
Source: Public Records
Tax History Compared to Growth
Tax History
| Year | Tax Paid | Tax Assessment Tax Assessment Total Assessment is a certain percentage of the fair market value that is determined by local assessors to be the total taxable value of land and additions on the property. | Land | Improvement |
|---|---|---|---|---|
| 2025 | $1,580 | $182,839 | $40,000 | $142,839 |
| 2024 | $1,534 | $182,839 | $40,000 | $142,839 |
| 2023 | $1,459 | $182,839 | $40,000 | $142,839 |
| 2022 | $859 | $77,118 | $32,000 | $45,118 |
| 2021 | $867 | $77,118 | $32,000 | $45,118 |
| 2020 | $875 | $77,118 | $32,000 | $45,118 |
| 2019 | $879 | $77,118 | $32,000 | $45,118 |
| 2018 | $0 | $77,118 | $32,000 | $45,118 |
| 2017 | $809 | $77,118 | $32,000 | $45,118 |
| 2016 | $906 | $84,678 | $30,000 | $54,678 |
| 2015 | $489 | $84,678 | $30,000 | $54,678 |
| 2014 | $457 | $86,644 | $30,000 | $56,644 |
Source: Public Records
Map
Nearby Homes
- 901 N Fifth St
- 205 Esteban Ct
- 112 N Sixth St
- 407 N Ninth St
- 402 W Clay St
- Lot# 2 Highway 70 E
- 513 N Carr St
- L279-280 N 10th St
- L277-278 N 10th St
- L37-41 N 10th St
- 104 E Wilson St
- 705 E Ashland Dr
- 701 N Carr St
- 503 E Graham St
- 409 Reinsman Ct
- 421 W Holt St
- 603 Village Lake Dr
- 609 Village Lake Dr
- 106 Circle Dr
- 1012 Lake Michael Way