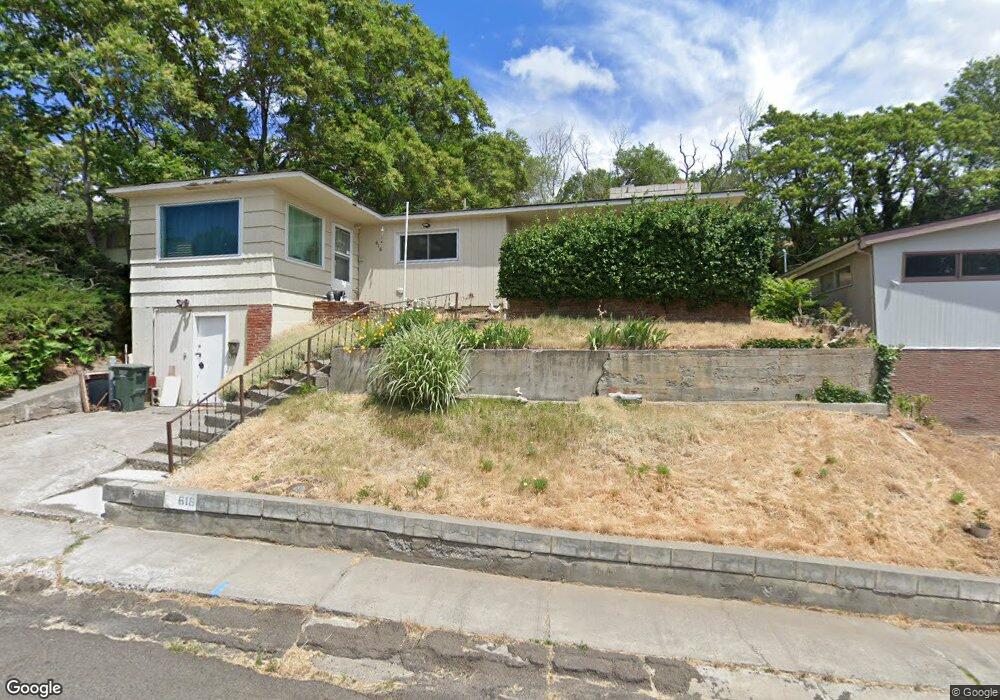
616 NW 7th St Pendleton, OR 97801
Estimated Value: $242,000 - $258,000
3
Beds
1
Bath
1,183
Sq Ft
$212/Sq Ft
Est. Value
About This Home
This home is located at 616 NW 7th St, Pendleton, OR 97801 and is currently estimated at $250,373, approximately $211 per square foot. 616 NW 7th St is a home located in Umatilla County with nearby schools including Washington Elementary School, Sunridge Middle School, and Pendleton High School.
Ownership History
Date
Name
Owned For
Owner Type
Purchase Details
Closed on
May 13, 2022
Sold by
Read Lonnie O
Bought by
Mina E Cox-South Living Trust
Current Estimated Value
Purchase Details
Closed on
Nov 1, 2019
Sold by
Cox South Mina E
Bought by
Cox South Mina E and Mina E Cox South Living Trust
Home Financials for this Owner
Home Financials are based on the most recent Mortgage that was taken out on this home.
Original Mortgage
$110,500
Interest Rate
3.65%
Mortgage Type
New Conventional
Purchase Details
Closed on
Apr 16, 2019
Sold by
Cox South Mina E
Bought by
Cox South Mina E and Mina E Cox South Living Trust
Create a Home Valuation Report for This Property
The Home Valuation Report is an in-depth analysis detailing your home's value as well as a comparison with similar homes in the area
Home Values in the Area
Average Home Value in this Area
Purchase History
| Date | Buyer | Sale Price | Title Company |
|---|---|---|---|
| Mina E Cox-South Living Trust | $750 | None Listed On Document | |
| Cox South Mina E | -- | None Available | |
| Cox South Mina E | -- | None Available | |
| Cox South Mina E | -- | None Available |
Source: Public Records
Mortgage History
| Date | Status | Borrower | Loan Amount |
|---|---|---|---|
| Previous Owner | Cox South Mina E | $110,500 |
Source: Public Records
Tax History
| Year | Tax Paid | Tax Assessment Tax Assessment Total Assessment is a certain percentage of the fair market value that is determined by local assessors to be the total taxable value of land and additions on the property. | Land | Improvement |
|---|---|---|---|---|
| 2022 | $1,930 | $106,710 | $0 | $0 |
| 2021 | $1,941 | $103,610 | $41,950 | $61,660 |
| 2020 | $1,875 | $100,600 | $40,730 | $59,870 |
| 2018 | $1,822 | $94,830 | $38,390 | $56,440 |
| 2017 | $1,778 | $92,070 | $37,270 | $54,800 |
| 2016 | $1,680 | $89,390 | $36,190 | $53,200 |
| 2015 | $1,681 | $81,820 | $33,120 | $48,700 |
| 2014 | $1,610 | $81,820 | $33,120 | $48,700 |
Source: Public Records
Map
Nearby Homes
Your Personal Tour Guide
Ask me questions while you tour the home.