Estimated Value: $369,000 - $431,000
4
Beds
2
Baths
2,186
Sq Ft
$181/Sq Ft
Est. Value
About This Home
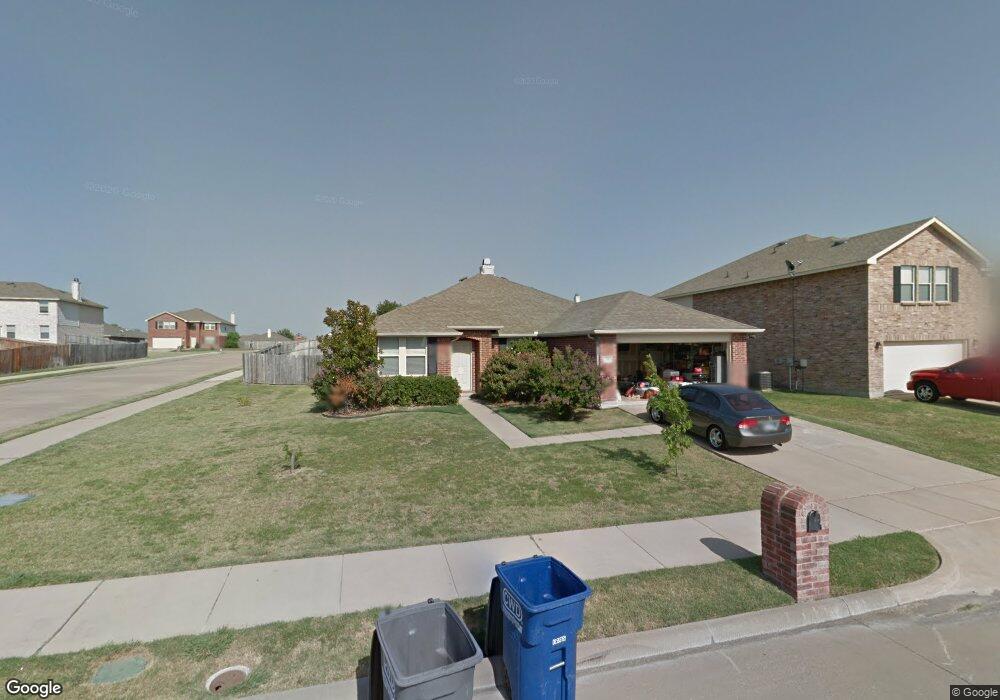
This home is located at 616 Odenville Dr, Wylie, TX 75098 and is currently estimated at $394,586, approximately $180 per square foot. 616 Odenville Dr is a home located in Collin County with nearby schools including Dodd Elementary School, Frank Mcmillan Junior High School, and Davis Intermediate School.
Ownership History
Date
Name
Owned For
Owner Type
Purchase Details
Closed on
Sep 4, 2020
Sold by
Henry Scott Alexander and Henry Kristen Marie
Bought by
Rogers Daniel Christopher
Current Estimated Value
Home Financials for this Owner
Home Financials are based on the most recent Mortgage that was taken out on this home.
Original Mortgage
$230,775
Outstanding Balance
$205,174
Interest Rate
3%
Mortgage Type
New Conventional
Estimated Equity
$189,412
Purchase Details
Closed on
Dec 8, 2004
Sold by
Centex Homes
Bought by
Henry Scott Alexander and Henry Kristen Marie
Home Financials for this Owner
Home Financials are based on the most recent Mortgage that was taken out on this home.
Original Mortgage
$147,128
Interest Rate
5.7%
Mortgage Type
VA
Create a Home Valuation Report for This Property
The Home Valuation Report is an in-depth analysis detailing your home's value as well as a comparison with similar homes in the area
Home Values in the Area
Average Home Value in this Area
Purchase History
| Date | Buyer | Sale Price | Title Company |
|---|---|---|---|
| Rogers Daniel Christopher | -- | Tatco | |
| Henry Scott Alexander | -- | -- |
Source: Public Records
Mortgage History
| Date | Status | Borrower | Loan Amount |
|---|---|---|---|
| Open | Rogers Daniel Christopher | $230,775 | |
| Previous Owner | Henry Scott Alexander | $147,128 |
Source: Public Records
Tax History Compared to Growth
Tax History
| Year | Tax Paid | Tax Assessment Tax Assessment Total Assessment is a certain percentage of the fair market value that is determined by local assessors to be the total taxable value of land and additions on the property. | Land | Improvement |
|---|---|---|---|---|
| 2025 | $5,851 | $398,753 | $99,750 | $332,698 |
| 2024 | $5,851 | $362,503 | $99,750 | $313,806 |
| 2023 | $5,851 | $329,548 | $84,000 | $321,446 |
| 2022 | $6,573 | $299,589 | $84,000 | $277,759 |
| 2021 | $6,408 | $272,354 | $68,250 | $204,104 |
| 2020 | $6,183 | $249,015 | $57,750 | $191,265 |
| 2019 | $6,347 | $241,522 | $57,750 | $201,820 |
| 2018 | $5,913 | $219,565 | $57,750 | $193,547 |
| 2017 | $5,230 | $229,274 | $52,500 | $176,774 |
| 2016 | $4,905 | $197,586 | $42,000 | $155,586 |
| 2015 | $3,986 | $160,486 | $36,750 | $123,736 |
Source: Public Records
Map
Nearby Homes
- 626 Gunters Mountain Ln
- 902 Greene Way
- 908 Greene Way
- 1003 Ann Dr
- 907 Carlton Rd
- 713 Kinston Ct
- 705 Baldwin Rd
- 913 Chickesaw Ln
- 1428 Mars Lander Ln
- 1426 Mars Lander Ln
- 1430 Mars Lander Ln
- 1432 Mars Lander Ln
- 1422 Mars Lander Ln
- Crest Plan at The Apollo
- Nova Plan at The Apollo
- Solis Plan at The Apollo
- 1434 Mars Lander Ln
- 1306 Ardmore Way
- 1305 Mobile Ln
- 410 Oxford Dr
- 614 Odenville Dr
- 700 Odenville Dr
- 617 Hanceville Way
- 612 Odenville Dr
- 615 Hanceville Way
- 617 Odenville Dr
- 701 Hanceville Way
- 613 Hanceville Way
- 615 Odenville Dr
- 610 Odenville Dr
- 702 Odenville Dr
- 701 Odenville Dr
- 613 Odenville Dr
- 611 Hanceville Way
- 703 Hanceville Way
- 703 Odenville Dr
- 611 Odenville Dr
- 608 Odenville Dr
- 704 Odenville Dr
- 609 Hanceville Way