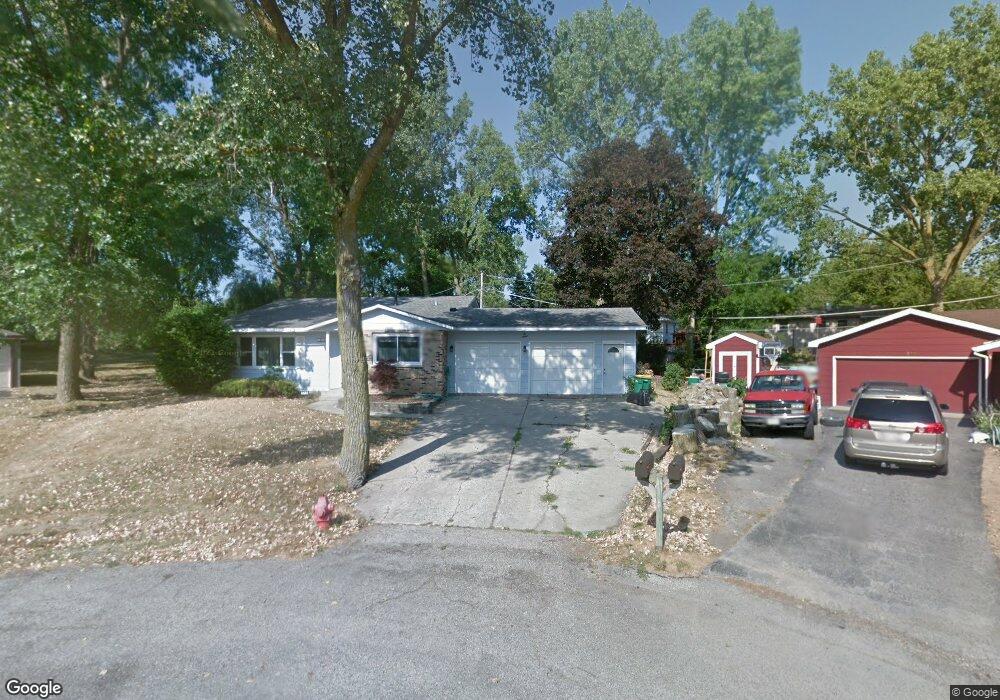
616 Pamela Ct Wauconda, IL 60084
Estimated Value: $292,000 - $332,688
3
Beds
2
Baths
1,548
Sq Ft
$202/Sq Ft
Est. Value
About This Home
This home is located at 616 Pamela Ct, Wauconda, IL 60084 and is currently estimated at $313,422, approximately $202 per square foot. 616 Pamela Ct is a home located in Lake County with nearby schools including Wauconda Grade School, Wauconda Middle School, and Wauconda High School.
Ownership History
Date
Name
Owned For
Owner Type
Purchase Details
Closed on
Mar 15, 2011
Sold by
Michiels Brenda
Bought by
Maksudian Carolyn A
Current Estimated Value
Home Financials for this Owner
Home Financials are based on the most recent Mortgage that was taken out on this home.
Original Mortgage
$126,670
Outstanding Balance
$88,255
Interest Rate
5.09%
Mortgage Type
FHA
Estimated Equity
$225,167
Purchase Details
Closed on
Aug 20, 2004
Sold by
Stewart Shelby E and Stewart Sherry
Bought by
Michiels Brenda
Home Financials for this Owner
Home Financials are based on the most recent Mortgage that was taken out on this home.
Original Mortgage
$182,400
Interest Rate
7.35%
Mortgage Type
Unknown
Purchase Details
Closed on
Feb 18, 1998
Sold by
Grand Premier Trust & Investment
Bought by
Stewart Shelby E and Stewart Sherry
Home Financials for this Owner
Home Financials are based on the most recent Mortgage that was taken out on this home.
Original Mortgage
$103,500
Interest Rate
6.95%
Create a Home Valuation Report for This Property
The Home Valuation Report is an in-depth analysis detailing your home's value as well as a comparison with similar homes in the area
Home Values in the Area
Average Home Value in this Area
Purchase History
| Date | Buyer | Sale Price | Title Company |
|---|---|---|---|
| Maksudian Carolyn A | $132,500 | First American Title Ins Co | |
| Michiels Brenda | $228,000 | First American Title Ins Co | |
| Stewart Shelby E | -- | Intercounty Title |
Source: Public Records
Mortgage History
| Date | Status | Borrower | Loan Amount |
|---|---|---|---|
| Open | Maksudian Carolyn A | $126,670 | |
| Previous Owner | Michiels Brenda | $182,400 | |
| Previous Owner | Stewart Shelby E | $103,500 | |
| Closed | Michiels Brenda | $45,600 |
Source: Public Records
Tax History Compared to Growth
Tax History
| Year | Tax Paid | Tax Assessment Tax Assessment Total Assessment is a certain percentage of the fair market value that is determined by local assessors to be the total taxable value of land and additions on the property. | Land | Improvement |
|---|---|---|---|---|
| 2024 | $6,088 | $76,541 | $19,851 | $56,690 |
| 2023 | $6,093 | $69,964 | $18,145 | $51,819 |
| 2022 | $6,093 | $61,838 | $19,358 | $42,480 |
| 2021 | $5,804 | $58,432 | $18,292 | $40,140 |
| 2020 | $5,607 | $55,692 | $17,434 | $38,258 |
| 2019 | $4,971 | $52,634 | $16,477 | $36,157 |
| 2018 | $4,565 | $45,716 | $15,431 | $30,285 |
| 2017 | $4,559 | $45,188 | $15,253 | $29,935 |
| 2016 | $4,264 | $42,792 | $14,444 | $28,348 |
| 2015 | $3,980 | $39,284 | $13,260 | $26,024 |
| 2014 | $4,800 | $42,833 | $14,855 | $27,978 |
| 2012 | $4,693 | $47,107 | $14,212 | $32,895 |
Source: Public Records
Map
Nearby Homes
- 0 Bonner Rd
- 28722 N Madison Ave
- 28855 N Garland Rd
- 28177 N Garland Rd
- 1260 Water Stone Cir
- 26049 N Il Route 59
- 29564 N Garland Rd
- 701 Lake Shore Dr
- 26241 W Bonner Rd
- 136 Parkview Dr Unit 5136
- 225 Regency Ct Unit A
- 235 Regency Ct Unit B
- 240 Regency Ct
- 302 Stillwater Ct Unit 1702
- 303 Stillwater Ct Unit 1106
- 309 Stillwater Ct Unit 1101
- 315 Hill St Unit A
- 325 Sundown Ct Unit B
- 450 N Main St Unit S307A
- 450 N Main St Unit S208A
- 615 Pamela Ct
- 614 Pamela Ct
- 1115 Washington Ave
- 1119 Washington Ave
- 1111 Washington Ave
- 624 E Bonner Rd
- 622 E Bonner Rd
- 618 E Bonner Rd
- 613 Pamela Ct
- 1109 Washington Ave
- 612 Pamela Ct
- 1121 Washington Ave
- 616 E Bonner Rd
- 1107 Washington Ave
- 611 Pamela Ct
- 610 Pamela Ct
- 1116 Barbara Ln
- 614 E Bonner Rd
- 1105 Washington Ave
- 1118 Barbara Ln