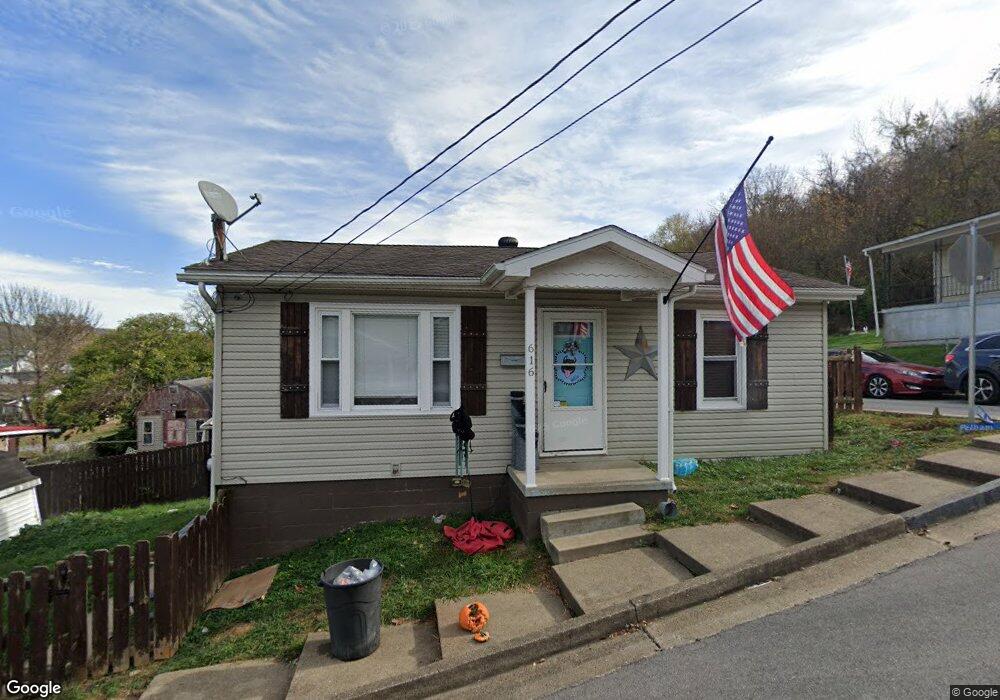
616 Pelham St Maysville, KY 41056
Estimated Value: $59,908 - $185,000
2
Beds
1
Bath
750
Sq Ft
$129/Sq Ft
Est. Value
About This Home
This home is located at 616 Pelham St, Maysville, KY 41056 and is currently estimated at $96,977, approximately $129 per square foot. 616 Pelham St is a home located in Mason County with nearby schools including Charles Straub Elementary School, Mason County Intermediate School, and Mason County Middle School.
Ownership History
Date
Name
Owned For
Owner Type
Purchase Details
Closed on
Jun 30, 2016
Sold by
Merrill Wenonah F
Bought by
Collins Dylan E
Current Estimated Value
Home Financials for this Owner
Home Financials are based on the most recent Mortgage that was taken out on this home.
Original Mortgage
$41,131
Outstanding Balance
$32,898
Interest Rate
3.64%
Mortgage Type
New Conventional
Estimated Equity
$64,079
Purchase Details
Closed on
Sep 17, 2014
Bought by
Merrill Wenonah
Create a Home Valuation Report for This Property
The Home Valuation Report is an in-depth analysis detailing your home's value as well as a comparison with similar homes in the area
Home Values in the Area
Average Home Value in this Area
Purchase History
| Date | Buyer | Sale Price | Title Company |
|---|---|---|---|
| Collins Dylan E | $40,000 | Clear Title | |
| Merrill Wenonah | $42,000 | -- |
Source: Public Records
Mortgage History
| Date | Status | Borrower | Loan Amount |
|---|---|---|---|
| Open | Collins Dylan E | $41,131 |
Source: Public Records
Tax History Compared to Growth
Tax History
| Year | Tax Paid | Tax Assessment Tax Assessment Total Assessment is a certain percentage of the fair market value that is determined by local assessors to be the total taxable value of land and additions on the property. | Land | Improvement |
|---|---|---|---|---|
| 2024 | $485 | $40,000 | $4,000 | $36,000 |
| 2023 | $496 | $40,000 | $4,000 | $36,000 |
| 2022 | $492 | $40,000 | $4,000 | $36,000 |
| 2021 | $496 | $40,000 | $4,000 | $36,000 |
| 2020 | $497 | $40,000 | $4,000 | $36,000 |
| 2019 | $498 | $40,000 | $4,000 | $36,000 |
| 2018 | $495 | $40,000 | $4,000 | $36,000 |
| 2017 | $473 | $40,000 | $4,000 | $36,000 |
| 2016 | -- | $40,000 | $4,000 | $36,000 |
| 2015 | -- | $42,000 | $4,000 | $38,000 |
| 2012 | -- | $8,000 | $3,000 | $5,000 |
Source: Public Records
Map
Nearby Homes