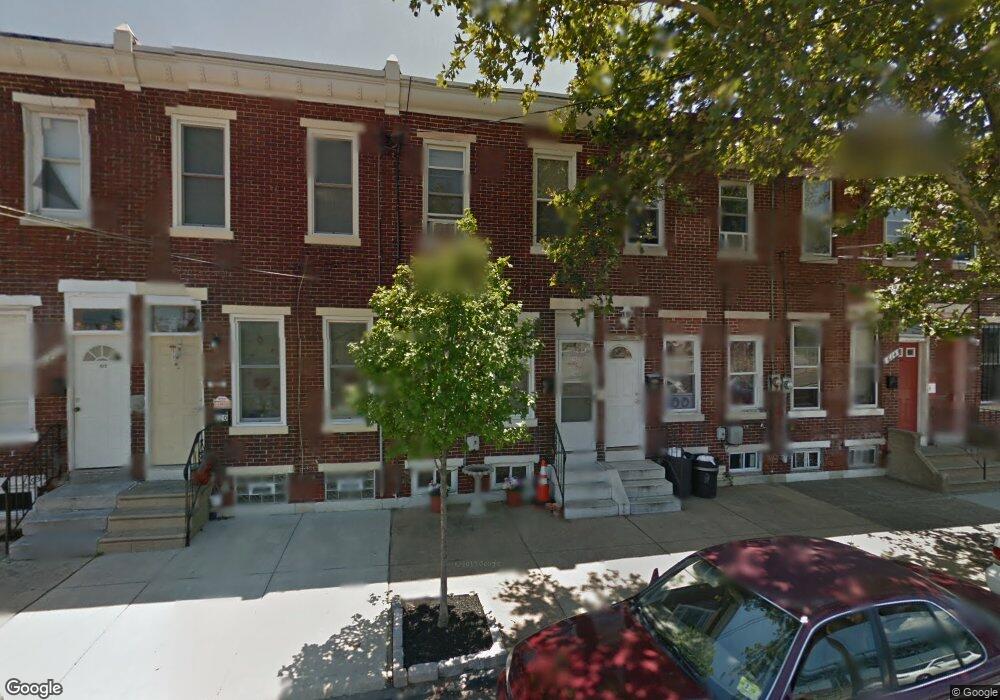
616 Point St Camden, NJ 08102
North Camden NeighborhoodEstimated Value: $132,411 - $240,000
Studio
--
Bath
1,402
Sq Ft
$130/Sq Ft
Est. Value
About This Home
This home is located at 616 Point St, Camden, NJ 08102 and is currently estimated at $182,603, approximately $130 per square foot. 616 Point St is a home located in Camden County with nearby schools including Cooper's Poynt Elementary School, Eastside High School, and Leap Academy University Charter School.
Ownership History
Date
Name
Owned For
Owner Type
Purchase Details
Closed on
Nov 5, 1999
Sold by
Pacific Property Development
Bought by
Pike Suzanne
Current Estimated Value
Home Financials for this Owner
Home Financials are based on the most recent Mortgage that was taken out on this home.
Original Mortgage
$36,349
Outstanding Balance
$11,105
Interest Rate
7.76%
Mortgage Type
FHA
Estimated Equity
$171,498
Purchase Details
Closed on
Oct 18, 1999
Sold by
Federal Housing Administration
Bought by
Pacific Property Development
Home Financials for this Owner
Home Financials are based on the most recent Mortgage that was taken out on this home.
Original Mortgage
$36,349
Outstanding Balance
$11,105
Interest Rate
7.76%
Mortgage Type
FHA
Estimated Equity
$171,498
Create a Home Valuation Report for This Property
The Home Valuation Report is an in-depth analysis detailing your home's value as well as a comparison with similar homes in the area
Home Values in the Area
Average Home Value in this Area
Purchase History
| Date | Buyer | Sale Price | Title Company |
|---|---|---|---|
| Pike Suzanne | $36,000 | -- | |
| Pacific Property Development | $12,200 | -- |
Source: Public Records
Mortgage History
| Date | Status | Borrower | Loan Amount |
|---|---|---|---|
| Open | Pike Suzanne | $36,349 |
Source: Public Records
Tax History
| Year | Tax Paid | Tax Assessment Tax Assessment Total Assessment is a certain percentage of the fair market value that is determined by local assessors to be the total taxable value of land and additions on the property. | Land | Improvement |
|---|---|---|---|---|
| 2025 | $2,253 | $63,600 | $10,100 | $53,500 |
| 2024 | $2,178 | $63,600 | $10,100 | $53,500 |
| 2023 | $2,178 | $63,600 | $10,100 | $53,500 |
| 2022 | $2,138 | $63,600 | $10,100 | $53,500 |
| 2021 | $2,130 | $63,600 | $10,100 | $53,500 |
| 2020 | $2,022 | $63,600 | $10,100 | $53,500 |
| 2019 | $1,937 | $63,600 | $10,100 | $53,500 |
| 2018 | $1,926 | $63,600 | $10,100 | $53,500 |
| 2017 | $1,879 | $63,600 | $10,100 | $53,500 |
| 2016 | $1,820 | $63,600 | $10,100 | $53,500 |
| 2015 | $1,752 | $63,600 | $10,100 | $53,500 |
| 2014 | $1,710 | $63,600 | $10,100 | $53,500 |
Source: Public Records
Map
Nearby Homes
Your Personal Tour Guide
Ask me questions while you tour the home.