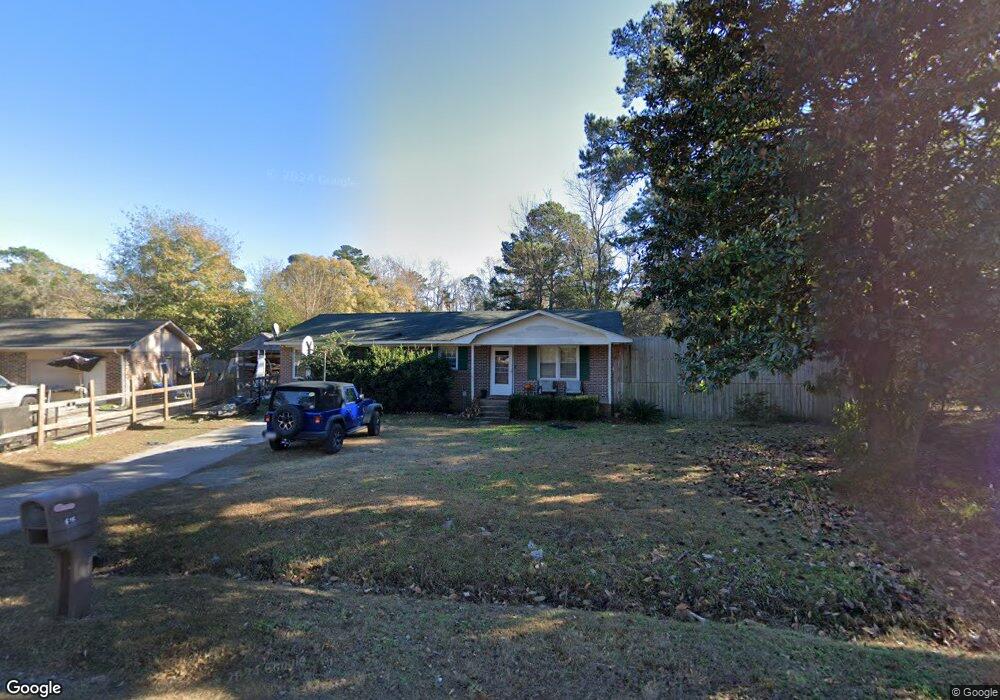
616 Rusty Rd Conway, SC 29526
Estimated Value: $155,000 - $248,000
2
Beds
1
Bath
1,026
Sq Ft
$210/Sq Ft
Est. Value
About This Home
This home is located at 616 Rusty Rd, Conway, SC 29526 and is currently estimated at $215,456, approximately $209 per square foot. 616 Rusty Rd is a home located in Horry County with nearby schools including Waccamaw Elementary School, Black Water Middle School, and Carolina Forest High School.
Ownership History
Date
Name
Owned For
Owner Type
Purchase Details
Closed on
Jan 21, 2010
Sold by
Wooley Irvin D
Bought by
Wooley Irvin D
Current Estimated Value
Purchase Details
Closed on
Apr 27, 2006
Sold by
Wheeler Mathew Roy and Estate Of Barbara M Wheeler Sm
Bought by
Wooley Irvin D and Wooley Nicole Suzanne
Home Financials for this Owner
Home Financials are based on the most recent Mortgage that was taken out on this home.
Original Mortgage
$10,900
Interest Rate
6.33%
Mortgage Type
Credit Line Revolving
Purchase Details
Closed on
Apr 26, 2000
Sold by
Jordan Samuel Wayne
Bought by
Smith Barbara
Purchase Details
Closed on
Sep 29, 1999
Sold by
Cassidy Tami L
Bought by
Jordan Samuel Wayne
Home Financials for this Owner
Home Financials are based on the most recent Mortgage that was taken out on this home.
Original Mortgage
$55,000
Interest Rate
7.58%
Mortgage Type
Purchase Money Mortgage
Create a Home Valuation Report for This Property
The Home Valuation Report is an in-depth analysis detailing your home's value as well as a comparison with similar homes in the area
Home Values in the Area
Average Home Value in this Area
Purchase History
| Date | Buyer | Sale Price | Title Company |
|---|---|---|---|
| Wooley Irvin D | -- | -- | |
| Wooley Irvin D | $109,000 | None Available | |
| Smith Barbara | $72,000 | -- | |
| Jordan Samuel Wayne | $44,000 | -- |
Source: Public Records
Mortgage History
| Date | Status | Borrower | Loan Amount |
|---|---|---|---|
| Previous Owner | Wooley Irvin D | $10,900 | |
| Previous Owner | Wooley Irvin D | $87,200 | |
| Previous Owner | Jordan Samuel Wayne | $55,000 |
Source: Public Records
Tax History
| Year | Tax Paid | Tax Assessment Tax Assessment Total Assessment is a certain percentage of the fair market value that is determined by local assessors to be the total taxable value of land and additions on the property. | Land | Improvement |
|---|---|---|---|---|
| 2025 | $1,344 | $0 | $0 | $0 |
| 2024 | $1,344 | $6,603 | $2,715 | $3,888 |
| 2023 | $1,344 | $5,428 | $1,690 | $3,738 |
| 2021 | $1,244 | $3,619 | $1,127 | $2,492 |
| 2020 | $1,158 | $3,619 | $1,127 | $2,492 |
| 2019 | $1,158 | $3,619 | $1,127 | $2,492 |
| 2018 | $1,067 | $3,208 | $1,032 | $2,176 |
| 2017 | $1,052 | $3,208 | $1,032 | $2,176 |
| 2016 | -- | $3,208 | $1,032 | $2,176 |
| 2015 | $1,052 | $3,208 | $1,032 | $2,176 |
| 2014 | $1,018 | $3,208 | $1,032 | $2,176 |
Source: Public Records
Map
Nearby Homes
- 615 Carter Ln Unit C2
- 615 Carter Ln Unit B1
- 601 Lincoln Ln
- 2311 S Carolina 544 Unit Kingswood
- 617 Truman Rd
- 631 Highway 544
- 3555 Highway 544 Overpass Unit 18H
- 3555 Highway 544 Overpass Unit 8H
- 3555 Highway 544 Overpass Unit 10H
- 3555 Highway 544 Overpass Unit 18G
- 3555 Highway 544 Overpass Unit 14G
- 437 W Cox Ferry Rd
- 3559 Highway 544 Overpass Unit 9F
- 921 Buccaneers Cove
- 1073 Causey Rd
- 1798 Barberry Dr
- TBD Highway 544
- 1046 Holt Rd
- 1025 Carolina Rd Unit V-1
- 1025 Carolina Rd Unit I7
- 614 Rusty Rd
- 618 Rusty Rd
- 615 Lesia Ln
- 613 Lesia Ln
- 615 Rusty Rd
- 612 Rusty Rd
- 617 Rusty Rd
- 621 Lesia Ln
- 611 Lesia Ln
- 613 Rusty Rd
- 620 Rusty Rd
- 619 Rusty Rd Unit Pine Valley Estate
- 610 Rusty Rd
- 129 Clifton Ct
- 129 Clandon Ct
- 620 Lesia Ln Unit Pine Valley Estates
- 611 Rusty Rd
- 622 Rusty Rd
- 608 Rusty Rd
- 621 Rusty Rd
Your Personal Tour Guide
Ask me questions while you tour the home.