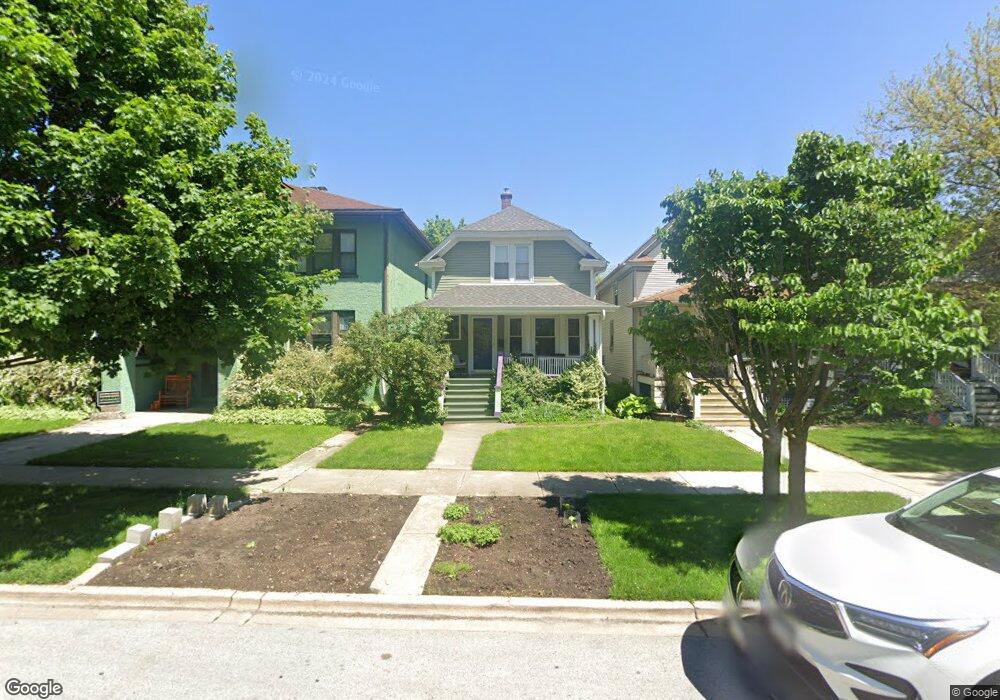
616 S Harvey Ave Oak Park, IL 60304
Estimated Value: $318,000 - $506,000
3
Beds
2
Baths
1,120
Sq Ft
$382/Sq Ft
Est. Value
About This Home
This home is located at 616 S Harvey Ave, Oak Park, IL 60304 and is currently estimated at $427,767, approximately $381 per square foot. 616 S Harvey Ave is a home located in Cook County with nearby schools including Longfellow Elementary School, Percy Julian Middle School, and Oak Park and River Forest High School.
Ownership History
Date
Name
Owned For
Owner Type
Purchase Details
Closed on
Jan 27, 2020
Sold by
Cuneen Gary and Cuneen Erica L
Bought by
Cuneen Gary
Current Estimated Value
Home Financials for this Owner
Home Financials are based on the most recent Mortgage that was taken out on this home.
Original Mortgage
$303,500
Outstanding Balance
$269,490
Interest Rate
3.75%
Mortgage Type
New Conventional
Estimated Equity
$158,277
Purchase Details
Closed on
May 29, 1997
Sold by
Springer Douglas W and Springer Julie
Bought by
Cuneen Gary and Cuneen Erica L
Home Financials for this Owner
Home Financials are based on the most recent Mortgage that was taken out on this home.
Original Mortgage
$156,600
Interest Rate
7.87%
Purchase Details
Closed on
Aug 13, 1994
Sold by
Cantlin Michael J and Cantlin Patricia L
Bought by
Springer Douglas W and Springer Julie
Home Financials for this Owner
Home Financials are based on the most recent Mortgage that was taken out on this home.
Original Mortgage
$130,317
Interest Rate
8.73%
Mortgage Type
FHA
Create a Home Valuation Report for This Property
The Home Valuation Report is an in-depth analysis detailing your home's value as well as a comparison with similar homes in the area
Home Values in the Area
Average Home Value in this Area
Purchase History
| Date | Buyer | Sale Price | Title Company |
|---|---|---|---|
| Cuneen Gary | -- | Prairie Title | |
| Cuneen Gary | $174,000 | -- | |
| Springer Douglas W | $132,500 | Land Title Group |
Source: Public Records
Mortgage History
| Date | Status | Borrower | Loan Amount |
|---|---|---|---|
| Open | Cuneen Gary | $303,500 | |
| Closed | Cuneen Gary | $156,600 | |
| Previous Owner | Springer Douglas W | $130,317 |
Source: Public Records
Tax History Compared to Growth
Tax History
| Year | Tax Paid | Tax Assessment Tax Assessment Total Assessment is a certain percentage of the fair market value that is determined by local assessors to be the total taxable value of land and additions on the property. | Land | Improvement |
|---|---|---|---|---|
| 2024 | $10,329 | $33,204 | $4,375 | $28,829 |
| 2023 | $10,312 | $35,000 | $4,375 | $30,625 |
| 2022 | $10,312 | $31,032 | $3,125 | $27,907 |
| 2021 | $11,038 | $32,827 | $3,125 | $29,702 |
| 2020 | $10,851 | $32,827 | $3,125 | $29,702 |
| 2019 | $9,728 | $28,785 | $2,812 | $25,973 |
| 2018 | $9,361 | $28,785 | $2,812 | $25,973 |
| 2017 | $9,178 | $28,785 | $2,812 | $25,973 |
| 2016 | $9,383 | $25,811 | $2,343 | $23,468 |
| 2015 | $8,362 | $25,811 | $2,343 | $23,468 |
| 2014 | $7,789 | $25,811 | $2,343 | $23,468 |
| 2013 | $7,802 | $26,602 | $2,343 | $24,259 |
Source: Public Records
Map
Nearby Homes
- 617 S Lombard Ave
- 612 S Lombard Ave
- 537 S Harvey Ave
- 537 S Cuyler Ave
- 433 S Lombard Ave Unit 33
- 426 S Lombard Ave Unit 205
- 208 S Austin Blvd
- 514 S Humphrey Ave
- 22 S Austin Blvd
- 243 Washington Blvd Unit 3A
- 241 Washington Blvd Unit G
- 237 Washington Blvd Unit G
- 7639 W Jackson Blvd Unit 1E
- 222 Washington Blvd Unit P14
- 410 S Austin Blvd Unit 3S
- 840 S Cuyler Ave
- 837 S Humphrey Ave
- 847 S Humphrey Ave Unit 1
- 1169 S Taylor Ave
- 331 S Ridgeland Ave Unit B
- 618 S Harvey Ave
- 620 S Harvey Ave
- 622 S Harvey Ave
- 608 S Harvey Ave
- 624 S Harvey Ave
- 606 S Harvey Ave
- 617 S Lombard Ave Unit 1
- 617 S Lombard Ave Unit 2
- 615 S Lombard Ave
- 626 S Harvey Ave
- 626 S Harvey Ave
- 619 S Lombard Ave Unit 1
- 619 S Lombard Ave Unit 2
- 604 S Harvey Ave
- 613 S Lombard Ave
- 621 S Lombard Ave
- 630 S Harvey Ave
- 609 S Lombard Ave
- 625 S Lombard Ave
- 600 S Harvey Ave