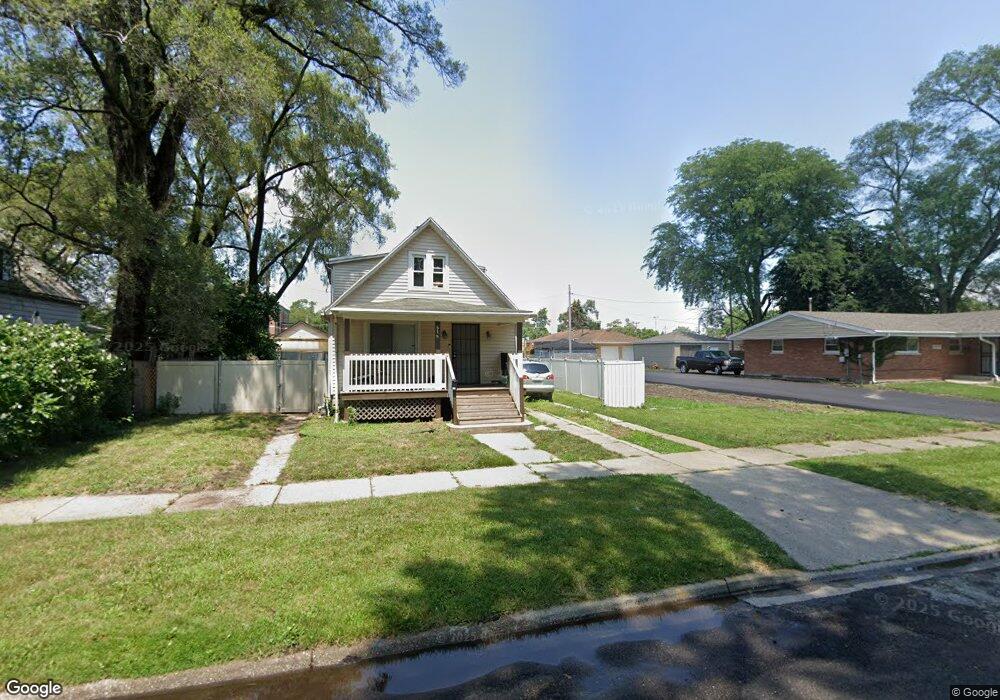
616 Stewart Ave Dolton, IL 60419
Estimated Value: $133,262 - $212,000
4
Beds
2
Baths
1,618
Sq Ft
$98/Sq Ft
Est. Value
About This Home
This home is located at 616 Stewart Ave, Dolton, IL 60419 and is currently estimated at $159,316, approximately $98 per square foot. 616 Stewart Ave is a home located in Cook County with nearby schools including Franklin Elementary School, Lincoln Junior High School, and Thornridge High School.
Ownership History
Date
Name
Owned For
Owner Type
Purchase Details
Closed on
Jun 29, 2018
Sold by
Nrmt Llc
Bought by
Wells Andre and Muhammad Wells Kamilah A
Current Estimated Value
Home Financials for this Owner
Home Financials are based on the most recent Mortgage that was taken out on this home.
Original Mortgage
$83,460
Outstanding Balance
$73,296
Interest Rate
5.12%
Mortgage Type
FHA
Estimated Equity
$86,020
Purchase Details
Closed on
Jun 19, 2017
Sold by
Atlantic Municipal Corp
Bought by
Nrmt Llc
Home Financials for this Owner
Home Financials are based on the most recent Mortgage that was taken out on this home.
Original Mortgage
$52,090
Interest Rate
10.5%
Mortgage Type
Unknown
Purchase Details
Closed on
Oct 25, 2010
Sold by
Orr David D
Bought by
Atlantic Municipal Corporation
Purchase Details
Closed on
Feb 26, 2007
Sold by
Belmont Realty Corp
Bought by
Green Debra
Purchase Details
Closed on
Jul 6, 2006
Sold by
Orr David D
Bought by
Belmont Realty Corp
Create a Home Valuation Report for This Property
The Home Valuation Report is an in-depth analysis detailing your home's value as well as a comparison with similar homes in the area
Home Values in the Area
Average Home Value in this Area
Purchase History
| Date | Buyer | Sale Price | Title Company |
|---|---|---|---|
| Wells Andre | $85,000 | None Available | |
| Nrmt Llc | $60,000 | Attorney | |
| Atlantic Municipal Corporation | -- | None Available | |
| Green Debra | -- | None Available | |
| Belmont Realty Corp | -- | None Available |
Source: Public Records
Mortgage History
| Date | Status | Borrower | Loan Amount |
|---|---|---|---|
| Open | Wells Andre | $83,460 | |
| Previous Owner | Nrmt Llc | $52,090 |
Source: Public Records
Tax History Compared to Growth
Tax History
| Year | Tax Paid | Tax Assessment Tax Assessment Total Assessment is a certain percentage of the fair market value that is determined by local assessors to be the total taxable value of land and additions on the property. | Land | Improvement |
|---|---|---|---|---|
| 2024 | $4,068 | $9,500 | $1,581 | $7,919 |
| 2023 | $4,124 | $9,500 | $1,581 | $7,919 |
| 2022 | $4,124 | $8,282 | $1,395 | $6,887 |
| 2021 | $4,150 | $8,282 | $1,395 | $6,887 |
| 2020 | $4,103 | $8,282 | $1,395 | $6,887 |
| 2019 | $6,510 | $7,427 | $1,302 | $6,125 |
| 2018 | $6,315 | $7,427 | $1,302 | $6,125 |
| 2017 | $5,944 | $7,427 | $1,302 | $6,125 |
| 2016 | $5,002 | $6,822 | $1,209 | $5,613 |
| 2015 | $4,849 | $6,822 | $1,209 | $5,613 |
| 2014 | $4,811 | $6,822 | $1,209 | $5,613 |
| 2013 | $4,521 | $6,972 | $1,209 | $5,763 |
Source: Public Records
Map
Nearby Homes
- 14806 Grant St
- 14701 Beachview Terrace
- 14714 Beachview Terrace
- 14625 Martin Luther King jr Dr
- 14619 Martin Luther King jr Dr
- 14909 Martin Luther King jr Dr
- 14828 Oak St
- 14900 Evers St
- 14915 Grant St
- 14528 Grant St
- 14900 Oak St
- 14647 Irving Ave
- 14640 Memorial Dr
- 500 Engle St
- 14838 Champlain St
- 14819 Champlain Ave
- 14915 Irving Ave
- 612 Margaret St
- 14930 Irving Ave
- 14449 Park Ave
- 612 Stewart Ave
- 624 Stewart Ave
- 624 Stewart Ave
- 624 E 148th St
- 617 E 147th Place
- 14744 Grant St
- 615 E 147th Place
- 14733 Chicago Rd
- 14735 Chicago Rd
- 623 E 147th Place
- 14727 Chicago Rd
- 625 E 147th Place
- 14725 Chicago Rd
- 14746 Grant St
- 14721 Chicago Rd
- 14750 Grant St
- 14745 Grant St
- 14717 Chicago Rd
- 14717 Doctor Martin Luther King Junior Dr