Estimated Value: $206,000 - $226,000
--
Bed
--
Bath
1,227
Sq Ft
$177/Sq Ft
Est. Value
About This Home
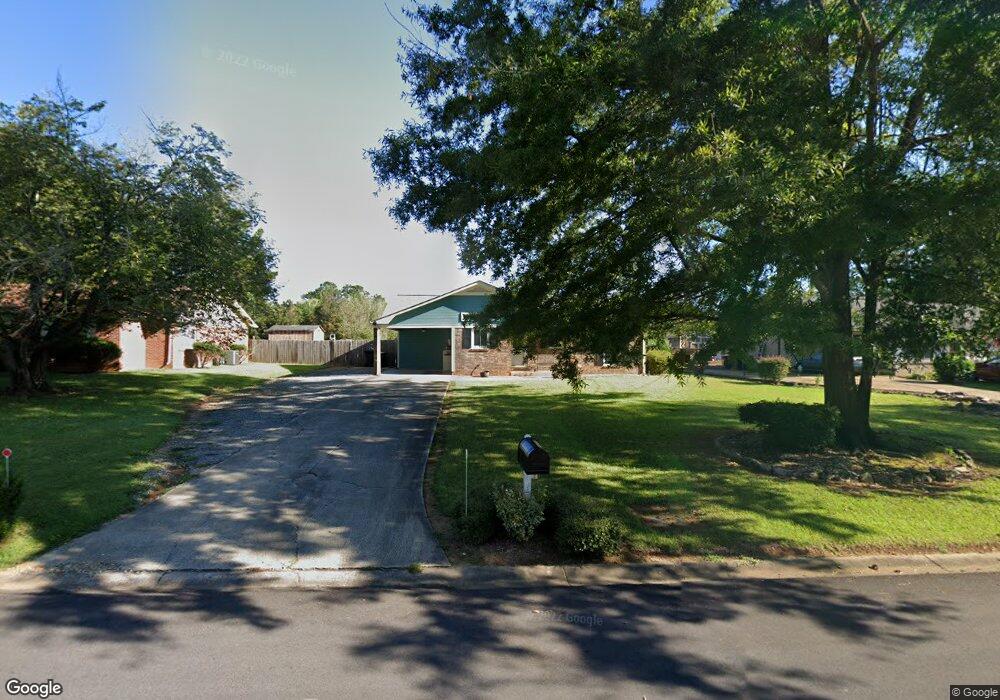
This home is located at 616 Trove Dr NW, Rome, GA 30165 and is currently estimated at $216,785, approximately $176 per square foot. 616 Trove Dr NW is a home located in Floyd County with nearby schools including Rome High School.
Ownership History
Date
Name
Owned For
Owner Type
Purchase Details
Closed on
Jul 9, 2018
Sold by
Robinson Sandra C
Bought by
Crow Cathy E
Current Estimated Value
Home Financials for this Owner
Home Financials are based on the most recent Mortgage that was taken out on this home.
Original Mortgage
$113,050
Outstanding Balance
$97,975
Interest Rate
4.5%
Mortgage Type
New Conventional
Estimated Equity
$118,810
Purchase Details
Closed on
Jun 30, 2003
Sold by
Dobson Kevin and Mandy Dobson
Bought by
Robinson Sandra C
Purchase Details
Closed on
Mar 31, 2000
Sold by
Smathers Jeff and Smathers Patricia
Bought by
Dobson Kevin and Mandy Dobson
Purchase Details
Closed on
Aug 13, 1993
Sold by
Lakes Construction Co Inc
Bought by
Smathers Jeff and Smathers Patricia
Purchase Details
Closed on
Jul 7, 1993
Sold by
Rives Steven L
Bought by
Lakes Construction Co Inc
Purchase Details
Closed on
Sep 29, 1989
Sold by
Fricks George L and Fricks Catherine
Bought by
Rives Steven L
Purchase Details
Closed on
Dec 30, 1987
Bought by
Fricks George L and Fricks Catherine
Create a Home Valuation Report for This Property
The Home Valuation Report is an in-depth analysis detailing your home's value as well as a comparison with similar homes in the area
Home Values in the Area
Average Home Value in this Area
Purchase History
| Date | Buyer | Sale Price | Title Company |
|---|---|---|---|
| Crow Cathy E | $119,000 | -- | |
| Robinson Sandra C | $87,000 | -- | |
| Dobson Kevin | $80,200 | -- | |
| Smathers Jeff | $60,400 | -- | |
| Lakes Construction Co Inc | $55,000 | -- | |
| Rives Steven L | $57,900 | -- | |
| Fricks George L | $55,700 | -- |
Source: Public Records
Mortgage History
| Date | Status | Borrower | Loan Amount |
|---|---|---|---|
| Open | Crow Cathy E | $113,050 |
Source: Public Records
Tax History Compared to Growth
Tax History
| Year | Tax Paid | Tax Assessment Tax Assessment Total Assessment is a certain percentage of the fair market value that is determined by local assessors to be the total taxable value of land and additions on the property. | Land | Improvement |
|---|---|---|---|---|
| 2024 | $1,338 | $71,833 | $7,040 | $64,793 |
| 2023 | $1,937 | $69,431 | $6,400 | $63,031 |
| 2022 | $1,760 | $55,264 | $5,120 | $50,144 |
| 2021 | $1,649 | $48,440 | $5,120 | $43,320 |
| 2020 | $1,607 | $45,311 | $3,840 | $41,471 |
| 2019 | $1,558 | $43,378 | $3,840 | $39,538 |
| 2018 | $1,216 | $35,108 | $3,840 | $31,268 |
| 2017 | $1,201 | $34,225 | $3,840 | $30,385 |
| 2016 | $1,195 | $33,732 | $3,840 | $29,892 |
| 2015 | $1,167 | $34,132 | $3,840 | $30,292 |
| 2014 | $1,167 | $35,791 | $3,840 | $31,951 |
Source: Public Records
Map
Nearby Homes
- 11 Pinestream Dr NW
- 2 Eugenia Cir NW
- 33 NW Hunters Glenn Rd
- 11 Simpson Dr NW
- 24 Conway Place NW
- 8 N Haven Dr
- 8 Ridge Haven Dr NW
- 7 N Haven Dr
- 25 Shoreline Dr NW
- 9 N Haven Dr
- 123 Trentwood Place NW
- 104 Sagewood Dr NW
- 3013 Garden Lakes Blvd NW
- 38 Boulder Dr NW
- 32 Donley Dr NW
- 8 Sagewood Dr NW
- 320 Elliott Dr NW
- 216 Huffaker Rd NW
- 8 Tall Pines Terrace NW
- 2614 Garden Lakes Blvd NW
- 59 Trove Dr NW
- 618 Trove Dr NW
- 614 Trove Dr NW
- 27 Frances Dr NW
- 29 Frances Dr NW
- 620 Trove Dr NW
- 612 Trove Dr NW
- 0 Trove Dr NW Unit 7466100
- 0 Trove Dr NW Unit 7359075
- 0 Trove Dr NW Unit 8691841
- 0 Trove Dr NW Unit 8520517
- 0 Trove Dr NW Unit 8426706
- 0 Trove Dr NW Unit 8409928
- 0 Trove Dr NW Unit 8317258
- 0 Trove Dr NW Unit 8208609
- 0 Trove Dr NW Unit 8421662
- 0 Trove Dr NW Unit 7314846
- 0 Trove Dr NW Unit 8748067
- 0 Trove Dr NW Unit 8769309
- 0 Trove Dr NW Unit 8784345