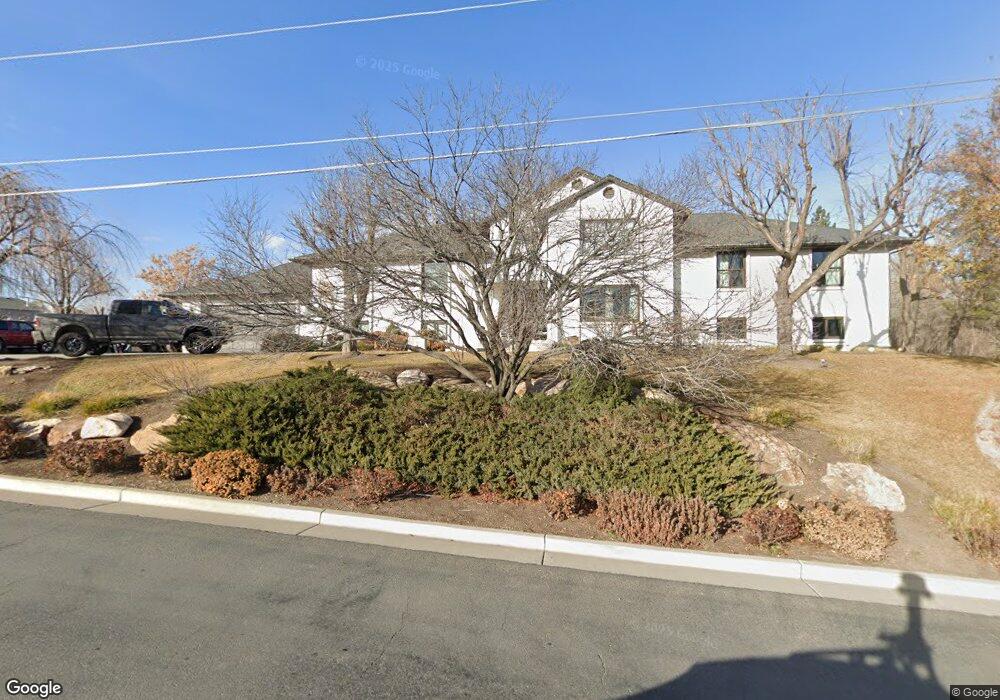
616 W 11400 S South Jordan, UT 84095
Estimated Value: $1,235,000 - $1,407,774
4
Beds
3
Baths
6,190
Sq Ft
$209/Sq Ft
Est. Value
About This Home
This home is located at 616 W 11400 S, South Jordan, UT 84095 and is currently estimated at $1,295,444, approximately $209 per square foot. 616 W 11400 S is a home located in Salt Lake County with nearby schools including South Jordan School, South Jordan Middle School, and Hawthorn Academy South Jordan.
Ownership History
Date
Name
Owned For
Owner Type
Purchase Details
Closed on
Dec 16, 2021
Sold by
Rivas Reina G
Bought by
Delgado Ovidio and Rodriguez Luselina
Current Estimated Value
Home Financials for this Owner
Home Financials are based on the most recent Mortgage that was taken out on this home.
Original Mortgage
$129,161
Outstanding Balance
$118,517
Interest Rate
3.09%
Mortgage Type
Purchase Money Mortgage
Estimated Equity
$1,176,927
Purchase Details
Closed on
Nov 12, 2021
Sold by
Ramirez Octaviano O and Alvarado Juana D
Bought by
Rivas Reina G
Home Financials for this Owner
Home Financials are based on the most recent Mortgage that was taken out on this home.
Original Mortgage
$129,161
Outstanding Balance
$118,517
Interest Rate
3.09%
Mortgage Type
Purchase Money Mortgage
Estimated Equity
$1,176,927
Purchase Details
Closed on
Sep 29, 2010
Sold by
Ramirez Octaviano O and Alvarado Juana D
Bought by
Utah Department Of Transportation
Create a Home Valuation Report for This Property
The Home Valuation Report is an in-depth analysis detailing your home's value as well as a comparison with similar homes in the area
Home Values in the Area
Average Home Value in this Area
Purchase History
| Date | Buyer | Sale Price | Title Company |
|---|---|---|---|
| Delgado Ovidio | -- | 1St Liberty Title | |
| Rivas Reina G | -- | 1St Liberty Title Lc | |
| Utah Department Of Transportation | -- | None Available |
Source: Public Records
Mortgage History
| Date | Status | Borrower | Loan Amount |
|---|---|---|---|
| Open | Rivas Reina G | $129,161 |
Source: Public Records
Tax History Compared to Growth
Tax History
| Year | Tax Paid | Tax Assessment Tax Assessment Total Assessment is a certain percentage of the fair market value that is determined by local assessors to be the total taxable value of land and additions on the property. | Land | Improvement |
|---|---|---|---|---|
| 2025 | $6,195 | $1,200,700 | $504,900 | $695,800 |
| 2024 | $6,195 | $1,173,500 | $389,800 | $783,700 |
| 2023 | $5,714 | $1,021,300 | $367,700 | $653,600 |
| 2022 | $6,113 | $1,070,800 | $360,500 | $710,300 |
| 2021 | $4,940 | $793,800 | $322,900 | $470,900 |
| 2020 | $4,568 | $688,100 | $223,400 | $464,700 |
| 2019 | $4,601 | $681,100 | $167,200 | $513,900 |
| 2018 | $4,375 | $644,400 | $167,200 | $477,200 |
| 2017 | $3,912 | $564,700 | $167,200 | $397,500 |
| 2016 | $3,940 | $538,800 | $157,400 | $381,400 |
| 2015 | $3,573 | $475,000 | $175,900 | $299,100 |
| 2014 | $3,404 | $444,700 | $167,300 | $277,400 |
Source: Public Records
Map
Nearby Homes
- 11324 S Trent Dr
- 724 W Maple Drift Ln
- 11534 Sweet Grass Ct
- 11187 S Devon View Dr
- Sonderborg Plan at Big Willow Creek - Collection & Cottage
- Lillehammer Plan at Big Willow Creek - Collection & Cottage
- Nyborg Plan at Big Willow Creek - Collection & Cottage
- Raleigh Traditional Plan at Big Willow Creek
- 498 W Maidengrass Way
- 504 W Maidengrass Way
- 11552 S Sweet Grass Ct
- 702 W Osborne Fox Way
- Bentley II Plan at Fox Landing
- Crescent Plan at Fox Landing
- Hensley Plan at Fox Landing
- Bayhill Plan at Fox Landing
- Rosamund Plan at Fox Landing
- Midway Plan at Fox Landing
- Stonehaven Plan at Fox Landing
- Belmont Plan at Fox Landing
- 633 W 11400 S
- 11370 S Brook N Lance
- 11370 S Brook N Lance
- 11370 S Brook N Lance
- 11363 S 675 W Unit 11371
- 11391 S 675 W
- 11383 Brooke-N-lance Ln
- 11383 Brook N Lance
- 11383 S Brook N Lance
- 361 W 11400 S
- 637 W 11400 S
- 11368 S Brook N Lance
- 11368 S Brook N Lance
- 11368 S Brook N Lance
- 11341 S 675 W
- 11374 Brook N Lance
- 696 W 11400 S
- 617 W 11400 S
- 11331 S Brook N Lance
- 11362 S 675 W