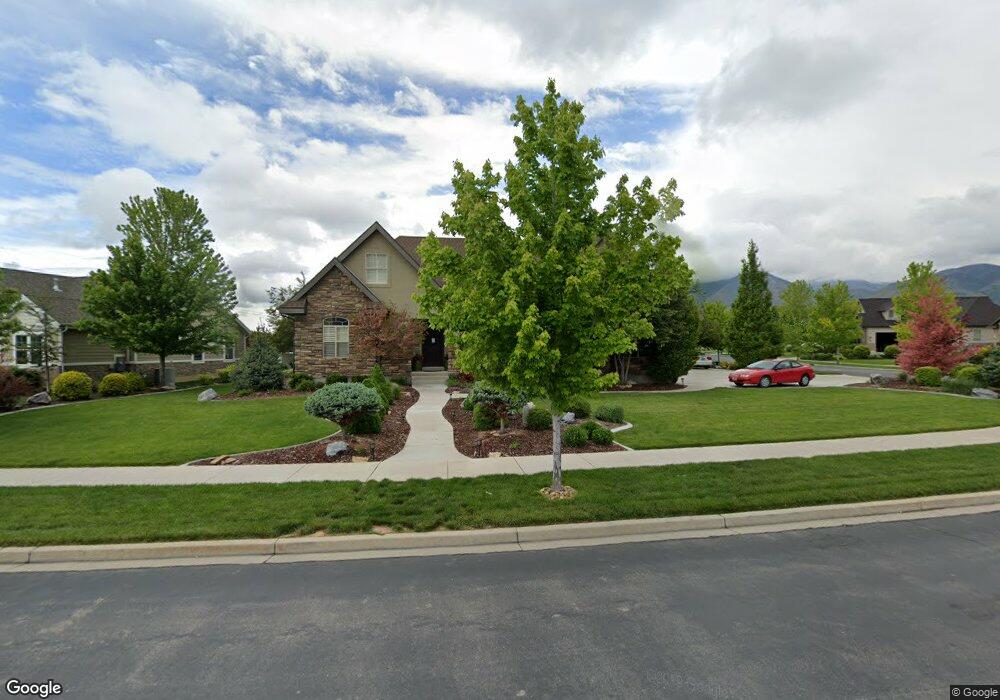
616 W 600 S Mapleton, UT 84664
Estimated Value: $1,108,000 - $1,403,000
6
Beds
4
Baths
6,000
Sq Ft
$216/Sq Ft
Est. Value
About This Home
This home is located at 616 W 600 S, Mapleton, UT 84664 and is currently estimated at $1,294,483, approximately $215 per square foot. 616 W 600 S is a home located in Utah County with nearby schools including Mapleton School, Mapleton Junior High School, and Maple Mountain High School.
Ownership History
Date
Name
Owned For
Owner Type
Purchase Details
Closed on
May 2, 2008
Sold by
Schellenberg Homes Llc
Bought by
Barton Daniel S and Barton Janet L
Current Estimated Value
Purchase Details
Closed on
Feb 9, 2007
Sold by
Simpson David R
Bought by
Schellenberg Homes Llc
Home Financials for this Owner
Home Financials are based on the most recent Mortgage that was taken out on this home.
Original Mortgage
$565,000
Interest Rate
6.17%
Mortgage Type
Construction
Purchase Details
Closed on
Aug 17, 2006
Sold by
Silver Leafe Cove Llc
Bought by
Condie Kenneth J
Create a Home Valuation Report for This Property
The Home Valuation Report is an in-depth analysis detailing your home's value as well as a comparison with similar homes in the area
Home Values in the Area
Average Home Value in this Area
Purchase History
| Date | Buyer | Sale Price | Title Company |
|---|---|---|---|
| Barton Daniel S | -- | None Available | |
| Schellenberg Homes Llc | -- | Pro Title & Escrow Inc | |
| Simpson David R | -- | Pro Title & Escrow Inc | |
| Condie Kenneth J | -- | Select Title Insurance Agen |
Source: Public Records
Mortgage History
| Date | Status | Borrower | Loan Amount |
|---|---|---|---|
| Previous Owner | Schellenberg Homes Llc | $565,000 |
Source: Public Records
Tax History
| Year | Tax Paid | Tax Assessment Tax Assessment Total Assessment is a certain percentage of the fair market value that is determined by local assessors to be the total taxable value of land and additions on the property. | Land | Improvement |
|---|---|---|---|---|
| 2025 | $5,562 | $618,365 | -- | -- |
| 2024 | $5,562 | $544,830 | $0 | $0 |
| 2023 | $5,818 | $573,540 | $0 | $0 |
| 2022 | $6,505 | $634,040 | $0 | $0 |
| 2021 | $5,651 | $845,700 | $213,500 | $632,200 |
| 2020 | $5,504 | $796,800 | $188,900 | $607,900 |
| 2019 | $4,734 | $699,500 | $188,900 | $510,600 |
| 2018 | $4,608 | $648,200 | $161,300 | $486,900 |
| 2017 | $4,689 | $350,020 | $0 | $0 |
| 2016 | $4,572 | $339,240 | $0 | $0 |
| 2015 | $4,482 | $330,550 | $0 | $0 |
| 2014 | -- | $291,280 | $0 | $0 |
Source: Public Records
Map
Nearby Homes
- 509 W 350 S Unit 30
- 4664 S 680 W Unit S204
- 4664 S 680 W Unit S203
- 4664 S 680 W Unit S302
- 4664 S 680 W Unit S303
- 4664 S 680 W Unit S201
- 4664 S 680 W Unit S202
- 4664 S 680 W Unit S304
- 4664 S 680 W Unit S301
- 4664 S 680 W Unit S102
- 4664 S 680 W Unit S101
- 896 W 675 S
- 415 S 1200 W
- 126 N 800 W
- 1158 S 980 W
- 2700 S Main St
- 415 E Maple St
- 1352 W 900 S
- 648 W 400 N
- 754 W 400 N Unit 29
Your Personal Tour Guide
Ask me questions while you tour the home.