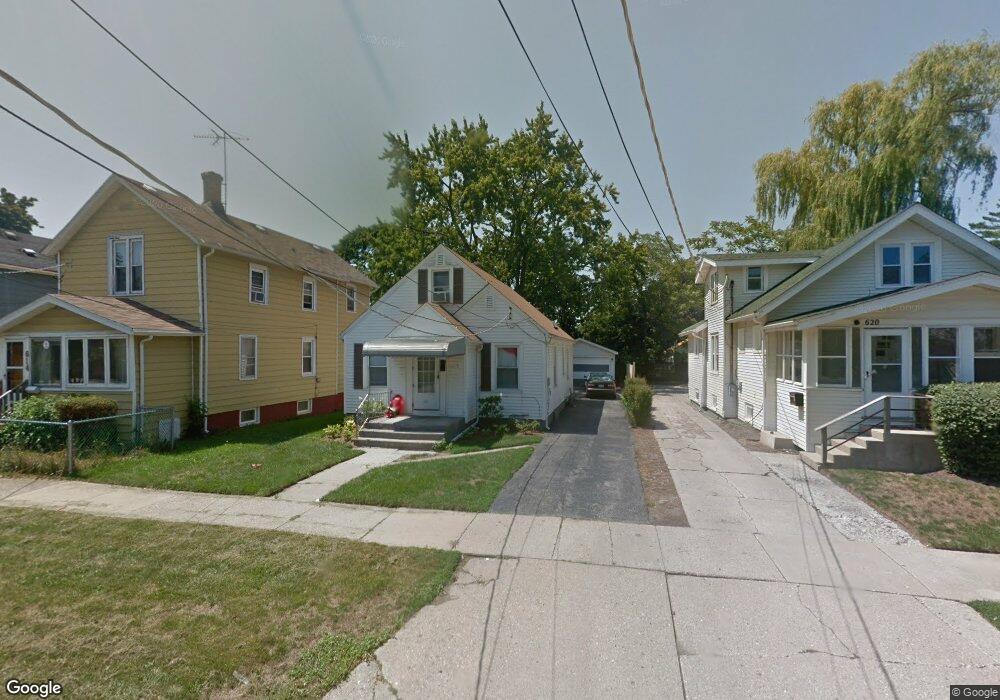
616 Walnut St Waukegan, IL 60085
Estimated Value: $184,761 - $224,000
2
Beds
1
Bath
900
Sq Ft
$221/Sq Ft
Est. Value
About This Home
This home is located at 616 Walnut St, Waukegan, IL 60085 and is currently estimated at $199,190, approximately $221 per square foot. 616 Walnut St is a home located in Lake County with nearby schools including Glen Flora Elementary School, Edith M Smith Middle School, and Waukegan High School.
Ownership History
Date
Name
Owned For
Owner Type
Purchase Details
Closed on
Aug 28, 2006
Sold by
Hernandez Jose G
Bought by
Hernandez Teresa M
Current Estimated Value
Purchase Details
Closed on
Jan 26, 1996
Sold by
Celesnik Lorraine and Bullock Joanne H
Bought by
Hernandez Jose G and Vasquez Teresa M
Home Financials for this Owner
Home Financials are based on the most recent Mortgage that was taken out on this home.
Original Mortgage
$68,303
Interest Rate
7.24%
Mortgage Type
FHA
Purchase Details
Closed on
Jun 7, 1994
Sold by
Celesnik Lorraine
Bought by
Celesnik Lorraine and Bullock Joanne H
Create a Home Valuation Report for This Property
The Home Valuation Report is an in-depth analysis detailing your home's value as well as a comparison with similar homes in the area
Home Values in the Area
Average Home Value in this Area
Purchase History
| Date | Buyer | Sale Price | Title Company |
|---|---|---|---|
| Hernandez Teresa M | -- | None Available | |
| Hernandez Jose G | $69,000 | -- | |
| Celesnik Lorraine | -- | -- |
Source: Public Records
Mortgage History
| Date | Status | Borrower | Loan Amount |
|---|---|---|---|
| Previous Owner | Hernandez Jose G | $68,303 |
Source: Public Records
Tax History Compared to Growth
Tax History
| Year | Tax Paid | Tax Assessment Tax Assessment Total Assessment is a certain percentage of the fair market value that is determined by local assessors to be the total taxable value of land and additions on the property. | Land | Improvement |
|---|---|---|---|---|
| 2024 | $3,032 | $44,855 | $7,051 | $37,804 |
| 2023 | $3,133 | $40,159 | $6,313 | $33,846 |
| 2022 | $3,133 | $38,052 | $6,005 | $32,047 |
| 2021 | $2,799 | $32,847 | $5,357 | $27,490 |
| 2020 | $2,789 | $30,601 | $4,991 | $25,610 |
| 2019 | $2,754 | $28,040 | $4,573 | $23,467 |
| 2018 | $3,053 | $29,997 | $5,824 | $24,173 |
| 2017 | $2,922 | $26,539 | $5,153 | $21,386 |
| 2016 | $2,637 | $23,062 | $4,478 | $18,584 |
| 2015 | $2,473 | $20,641 | $4,008 | $16,633 |
| 2014 | $1,786 | $16,546 | $3,068 | $13,478 |
| 2012 | $2,528 | $17,925 | $3,323 | $14,602 |
Source: Public Records
Map
Nearby Homes
- 620 N Poplar St
- 702 Franklin St
- 522 N Poplar St
- 511 Chestnut St
- 428 N Poplar St
- 509 N Butrick St
- 1109 Massena Ave
- 917 N Linden Ave
- 824 N Butrick St
- 918 N Ash St
- 1000 Pine St
- 452 North Ave
- 1105 Woodlawn Cir
- 325 4th St
- 1110 N Ash St
- 1122 N Ash St
- 968 Judge Ave
- 415 W Ridgeland Ave
- 23 N Jackson St
- 28 N Saint James St