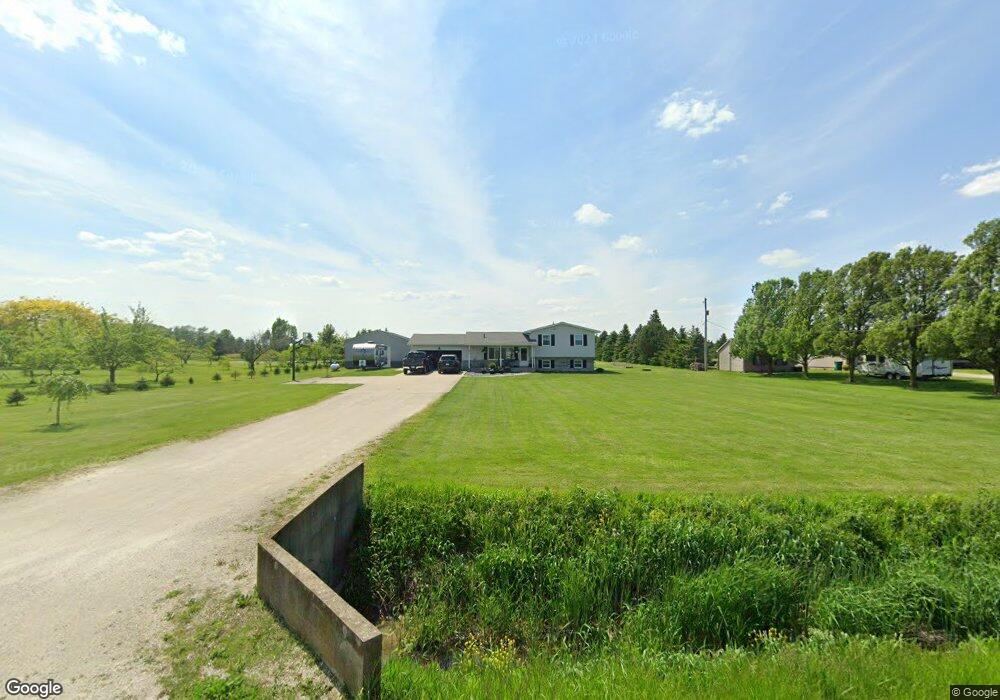
6160 N Opfer Lentz Rd Curtice, OH 43412
Estimated Value: $296,000 - $344,000
3
Beds
3
Baths
1,852
Sq Ft
$171/Sq Ft
Est. Value
About This Home
This home is located at 6160 N Opfer Lentz Rd, Curtice, OH 43412 and is currently estimated at $315,818, approximately $170 per square foot. 6160 N Opfer Lentz Rd is a home located in Ottawa County with nearby schools including Genoa Elementary School.
Ownership History
Date
Name
Owned For
Owner Type
Purchase Details
Closed on
Jan 14, 2013
Sold by
Zaciewski Michael J and Despones Jessica A
Bought by
Canter Russell L
Current Estimated Value
Home Financials for this Owner
Home Financials are based on the most recent Mortgage that was taken out on this home.
Original Mortgage
$136,000
Outstanding Balance
$94,295
Interest Rate
3.31%
Mortgage Type
New Conventional
Estimated Equity
$221,523
Purchase Details
Closed on
Aug 19, 2009
Sold by
Albright Michael J
Bought by
Zaciewski Michael J and Despones Jessica A
Home Financials for this Owner
Home Financials are based on the most recent Mortgage that was taken out on this home.
Original Mortgage
$118,000
Interest Rate
5.29%
Mortgage Type
New Conventional
Create a Home Valuation Report for This Property
The Home Valuation Report is an in-depth analysis detailing your home's value as well as a comparison with similar homes in the area
Home Values in the Area
Average Home Value in this Area
Purchase History
| Date | Buyer | Sale Price | Title Company |
|---|---|---|---|
| Canter Russell L | $160,000 | Liberty Title Inc | |
| Zaciewski Michael J | $148,000 | Attorney |
Source: Public Records
Mortgage History
| Date | Status | Borrower | Loan Amount |
|---|---|---|---|
| Open | Canter Russell L | $136,000 | |
| Previous Owner | Zaciewski Michael J | $118,000 |
Source: Public Records
Tax History Compared to Growth
Tax History
| Year | Tax Paid | Tax Assessment Tax Assessment Total Assessment is a certain percentage of the fair market value that is determined by local assessors to be the total taxable value of land and additions on the property. | Land | Improvement |
|---|---|---|---|---|
| 2024 | $3,897 | $86,157 | $20,297 | $65,860 |
| 2023 | $3,897 | $58,437 | $10,049 | $48,388 |
| 2022 | $2,993 | $58,437 | $10,049 | $48,388 |
| 2021 | $2,641 | $58,430 | $10,050 | $48,380 |
| 2020 | $2,776 | $58,430 | $10,050 | $48,380 |
| 2019 | $2,755 | $58,430 | $10,050 | $48,380 |
| 2018 | $2,453 | $54,020 | $10,050 | $43,970 |
| 2017 | $2,405 | $50,110 | $10,050 | $40,060 |
| 2016 | $2,414 | $50,110 | $10,050 | $40,060 |
| 2015 | $2,319 | $47,840 | $10,050 | $37,790 |
| 2014 | $1,100 | $49,010 | $10,050 | $38,960 |
| 2013 | $1,103 | $49,010 | $10,050 | $38,960 |
Source: Public Records
Map
Nearby Homes
- 21224 W Toledo St
- 0 W Walbridge Rd
- Track 1 W Walbridge Rd
- 19367 W Walbridge Rd
- 7105 N Elliston Trowbridge Rd
- 6927 N Wildacre Rd
- 445 S Yondota Rd
- 725 Donovan Rd
- 9015 Seaman Rd
- 7330 Jerusalem Rd
- 24181 W James Ridge Rd
- 1861 N Opfer-Lentz Rd
- 0 N Graytown Rd
- 405 Lakemore Rd
- 1031 N Cousino Rd
- 434 Beachview Rd
- 549 Beachview Rd
- 6645 Seaman Rd
- 11944 Corduroy Rd
- 645 Clubhouse Rd
- 6186 N Opfer Lentz Rd
- 6100 N Opfer Lentz Rd
- 6248 N Opfer Lentz Rd
- 6040 N Opfer Lentz Rd
- 20117 W State Route 579
- 6272 N Opfer Lentz Rd
- 6302 N Opfer Lentz Rd
- 20191 W State Route 579
- 19885 W State Route 579
- 6340 N Opfer Lentz Rd
- 19861 Ohio 579
- 19861 W State Route 579
- 20211 W State Route 579
- 5921 N Opfer Lentz Rd
- 4 LOT Williston (Sr 579)
- 20249 W State Route 579
- 6400 N Opfer Lentz Rd
- 19781 W State Route 579
- 20353 W State Route 579
- 6442 N Opfer Lentz Rd