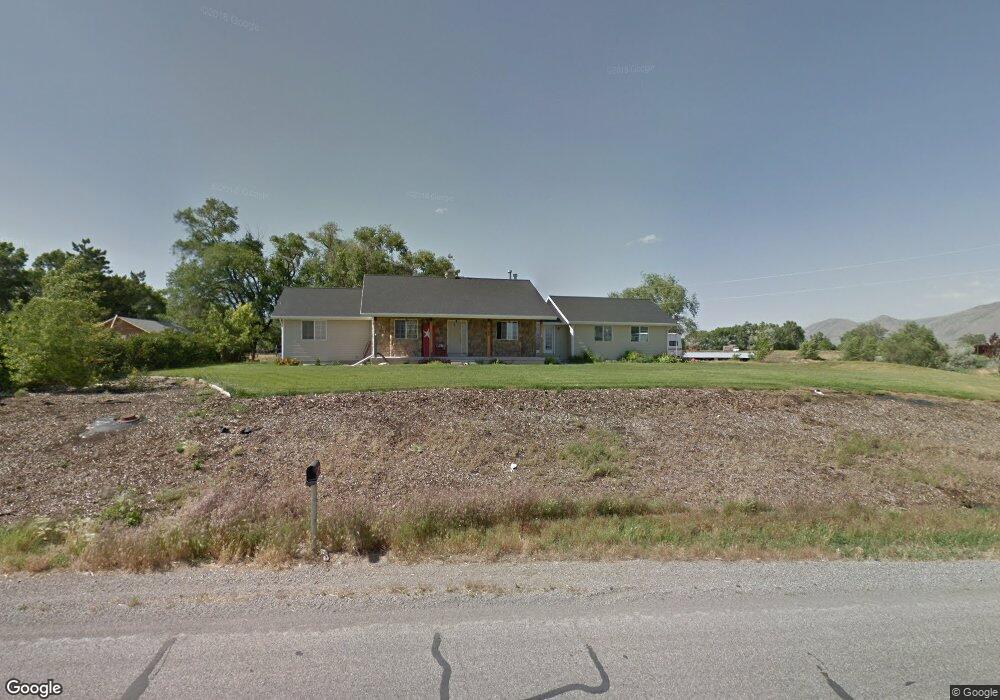
6160 W 8000 N Tremonton, UT 84337
Estimated Value: $586,000 - $648,000
4
Beds
4
Baths
3,600
Sq Ft
$170/Sq Ft
Est. Value
About This Home
This home is located at 6160 W 8000 N, Tremonton, UT 84337 and is currently estimated at $611,088, approximately $169 per square foot. 6160 W 8000 N is a home located in Box Elder County with nearby schools including Century School, Alice C. Harris Intermediate School, and Bear River Middle School.
Ownership History
Date
Name
Owned For
Owner Type
Purchase Details
Closed on
Feb 14, 2022
Sold by
Nash Theurer Teancum
Bought by
Olson Joseph and Olson Lacey D
Current Estimated Value
Home Financials for this Owner
Home Financials are based on the most recent Mortgage that was taken out on this home.
Original Mortgage
$423,999
Outstanding Balance
$338,197
Interest Rate
2.79%
Mortgage Type
New Conventional
Estimated Equity
$272,891
Purchase Details
Closed on
Oct 7, 2019
Sold by
Theurer Brady and Theurer Aimee
Bought by
Theurer Teancum Nash
Home Financials for this Owner
Home Financials are based on the most recent Mortgage that was taken out on this home.
Original Mortgage
$305,480
Interest Rate
3.5%
Mortgage Type
New Conventional
Create a Home Valuation Report for This Property
The Home Valuation Report is an in-depth analysis detailing your home's value as well as a comparison with similar homes in the area
Home Values in the Area
Average Home Value in this Area
Purchase History
| Date | Buyer | Sale Price | Title Company |
|---|---|---|---|
| Olson Joseph | -- | First American Title | |
| Theurer Teancum Nash | -- | Northern Title Company |
Source: Public Records
Mortgage History
| Date | Status | Borrower | Loan Amount |
|---|---|---|---|
| Open | Olson Joseph | $423,999 | |
| Previous Owner | Theurer Teancum Nash | $305,480 |
Source: Public Records
Tax History Compared to Growth
Tax History
| Year | Tax Paid | Tax Assessment Tax Assessment Total Assessment is a certain percentage of the fair market value that is determined by local assessors to be the total taxable value of land and additions on the property. | Land | Improvement |
|---|---|---|---|---|
| 2025 | $2,447 | $532,483 | $130,000 | $402,483 |
| 2024 | $2,447 | $522,969 | $128,000 | $394,969 |
| 2023 | $2,479 | $540,769 | $135,000 | $405,769 |
| 2022 | $2,387 | $265,810 | $26,675 | $239,135 |
| 2021 | $2,030 | $339,495 | $48,500 | $290,995 |
| 2020 | $1,958 | $339,495 | $48,500 | $290,995 |
| 2019 | $1,688 | $152,540 | $26,675 | $125,865 |
| 2018 | $1,803 | $152,540 | $26,675 | $125,865 |
| 2017 | $1,867 | $277,345 | $26,675 | $228,845 |
| 2016 | $1,843 | $146,546 | $26,675 | $119,871 |
| 2015 | $1,671 | $135,649 | $26,675 | $108,974 |
| 2014 | $1,671 | $130,459 | $26,675 | $103,784 |
| 2013 | -- | $60,545 | $26,675 | $33,870 |
Source: Public Records
Map
Nearby Homes
- 9190 N 6000 W
- 9270 N 5600 W Unit 7
- 9290 N 5600 W Unit 5
- 4677 W 8100 N
- Emerson 1797 Plan at The Estates At Riverview - The Estates
- Ridge Plan at The Estates At Riverview - The Estates
- 8185 N 4600 W
- 9480 N 5600 W
- 4693 W 9120 N
- 6690 W 10125 N
- 6710 W 10125 N
- 10160 N 6800 W
- 181 W 1300 S Unit 31
- 208 W 1300 S
- Harvest Village Plan at Harvest Village Townhome Community - Harvest Village
- 44 E 1225 S
- 62 E 1225 S
- 1215 S 100 E
- 4798 W 6000 N
- Phoenix Plan at Harvest Acres