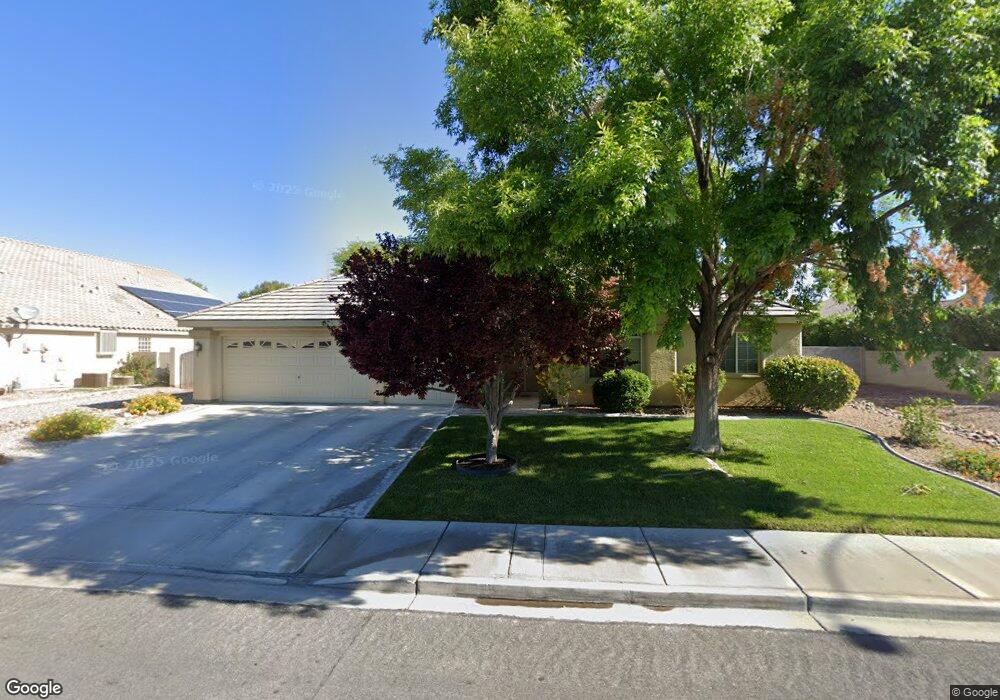
6160 W Azure Dr Unit 2 Las Vegas, NV 89130
North Cheyenne NeighborhoodEstimated Value: $691,000 - $721,000
4
Beds
3
Baths
3,090
Sq Ft
$229/Sq Ft
Est. Value
About This Home
This home is located at 6160 W Azure Dr Unit 2, Las Vegas, NV 89130 and is currently estimated at $706,544, approximately $228 per square foot. 6160 W Azure Dr Unit 2 is a home located in Clark County with nearby schools including Joseph M Neal Elementary School, Anthony Saville Middle School, and Shadow Ridge High School.
Ownership History
Date
Name
Owned For
Owner Type
Purchase Details
Closed on
May 19, 2015
Sold by
Robertson Cahrles T and Robertson Janet Y
Bought by
The Robertson Family Trust
Current Estimated Value
Purchase Details
Closed on
Oct 11, 2004
Sold by
Walker Thomas and Walker Cheryl M
Bought by
Robertson Charles T and Robertson Janet Y
Home Financials for this Owner
Home Financials are based on the most recent Mortgage that was taken out on this home.
Original Mortgage
$420,000
Outstanding Balance
$208,702
Interest Rate
5.82%
Mortgage Type
Unknown
Estimated Equity
$497,842
Purchase Details
Closed on
Aug 28, 2002
Sold by
U S Home Corp
Bought by
Walker Thomas and Walker Cheryl M
Home Financials for this Owner
Home Financials are based on the most recent Mortgage that was taken out on this home.
Original Mortgage
$254,500
Interest Rate
6.43%
Create a Home Valuation Report for This Property
The Home Valuation Report is an in-depth analysis detailing your home's value as well as a comparison with similar homes in the area
Home Values in the Area
Average Home Value in this Area
Purchase History
| Date | Buyer | Sale Price | Title Company |
|---|---|---|---|
| The Robertson Family Trust | -- | None Available | |
| Robertson Charles T | $499,000 | Land Title Of Nevada | |
| Walker Thomas | $267,963 | Stewart Title |
Source: Public Records
Mortgage History
| Date | Status | Borrower | Loan Amount |
|---|---|---|---|
| Open | Robertson Charles T | $420,000 | |
| Previous Owner | Walker Thomas | $254,500 |
Source: Public Records
Tax History Compared to Growth
Tax History
| Year | Tax Paid | Tax Assessment Tax Assessment Total Assessment is a certain percentage of the fair market value that is determined by local assessors to be the total taxable value of land and additions on the property. | Land | Improvement |
|---|---|---|---|---|
| 2025 | $3,421 | $186,755 | $61,740 | $125,015 |
| 2024 | $3,322 | $186,755 | $61,740 | $125,015 |
| 2023 | $3,322 | $168,814 | $51,083 | $117,731 |
| 2022 | $3,225 | $149,996 | $42,263 | $107,733 |
| 2021 | $3,131 | $139,046 | $36,750 | $102,296 |
| 2020 | $3,037 | $140,788 | $39,323 | $101,465 |
| 2019 | $2,949 | $130,650 | $30,870 | $99,780 |
| 2018 | $2,863 | $123,499 | $27,563 | $95,936 |
| 2017 | $3,866 | $117,939 | $27,563 | $90,376 |
| 2016 | $2,711 | $107,438 | $21,175 | $86,263 |
| 2015 | $2,706 | $92,104 | $18,480 | $73,624 |
| 2014 | $2,626 | $77,738 | $12,600 | $65,138 |
Source: Public Records
Map
Nearby Homes
- 6141 Markleham Ave
- 6124 Arwells Corner Ct
- 6245 Hawthorn Woods Ave
- 6132 Peggotty Ave
- 6116 Cottontail Cove St
- 6128 Rabbit Track St
- 6204 Muirlands Ct
- 6201 Eagle Crossing St
- 5832 Farnsworth Pond Ave
- 5808 Spinnaker Reach Ave
- 5940 Jasper Ridge St
- 6099 Ryan Ranch Ave
- 6101 Port of Dreams Dr
- 5840 McLennan Ranch Ave
- 6524 Convinto St
- 6442 American Eagle Ave
- 6500 Bullring Ln
- 5845 Thai Coast St
- 6466 American Eagle Ave
- 6517 Mission Crest Ave
- 6200 W Azure Dr
- 6149 Markleham Ave
- 6145 Markleham Ave
- 6201 Markleham Ave
- 6133 Molly Malone Ct
- 6132 Arwells Corner Ct
- 6210 W Azure Dr Unit 2
- 6205 Markleham Ave Unit 2
- 6140 W Azure Dr
- 6137 Markleham Ave
- 6129 Molly Malone Ct
- 6132 Molly Malone Ct
- 6128 Arwells Corner Ct
- 6209 Markleham Ave Unit 2
- 6216 Clover Creek Ct Unit 2
- 6133 Markleham Ave
- 6133 Arwells Corner Ct
- 6128 Molly Malone Ct
- 6217 Clover Creek Ct