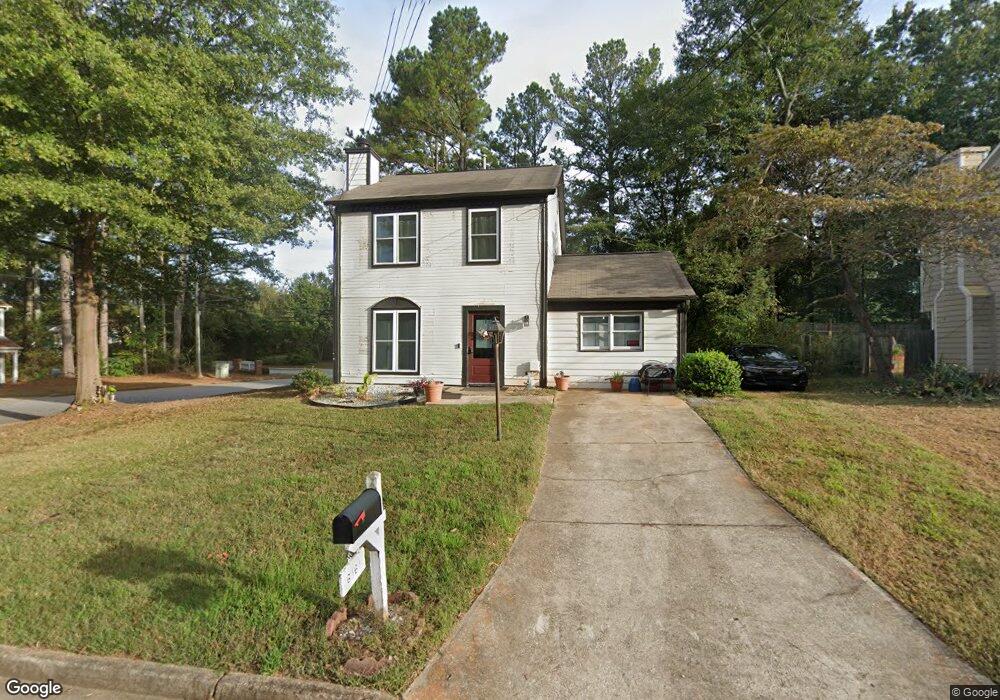
6161 Saint Charles Ct Lithonia, GA 30058
Estimated Value: $201,173 - $208,000
3
Beds
3
Baths
1,476
Sq Ft
$139/Sq Ft
Est. Value
About This Home
This home is located at 6161 Saint Charles Ct, Lithonia, GA 30058 and is currently estimated at $205,793, approximately $139 per square foot. 6161 Saint Charles Ct is a home located in DeKalb County with nearby schools including Panola Way Elementary School, Lithonia Middle School, and Lithonia High School.
Ownership History
Date
Name
Owned For
Owner Type
Purchase Details
Closed on
May 6, 2019
Sold by
Paladin Fund Ii Llc
Bought by
Frederick Dinah F
Current Estimated Value
Purchase Details
Closed on
Jul 19, 2013
Sold by
Black Castle Development L
Bought by
Pearl Edward Investments
Purchase Details
Closed on
Jun 5, 2012
Sold by
Dekalb County Tax Commissi
Bought by
Black Castle Development Llc
Purchase Details
Closed on
Feb 7, 2012
Sold by
Redmond Doreen
Bought by
Paladin Fund Ii Llc
Purchase Details
Closed on
Jun 15, 2011
Sold by
Pearl Edward Investments
Bought by
Redmond Doreen
Purchase Details
Closed on
Oct 5, 2010
Sold by
Sheriff Of Dekalb County
Bought by
Pearl Edward Investments
Create a Home Valuation Report for This Property
The Home Valuation Report is an in-depth analysis detailing your home's value as well as a comparison with similar homes in the area
Home Values in the Area
Average Home Value in this Area
Purchase History
| Date | Buyer | Sale Price | Title Company |
|---|---|---|---|
| Frederick Dinah F | $32,377 | -- | |
| Pearl Edward Investments | $6,500 | -- | |
| Black Castle Development Llc | $5,000 | -- | |
| Paladin Fund Ii Llc | -- | -- | |
| Redmond Doreen | -- | -- | |
| Pearl Edward Investments | $4,350 | -- |
Source: Public Records
Tax History Compared to Growth
Tax History
| Year | Tax Paid | Tax Assessment Tax Assessment Total Assessment is a certain percentage of the fair market value that is determined by local assessors to be the total taxable value of land and additions on the property. | Land | Improvement |
|---|---|---|---|---|
| 2025 | $620 | $79,480 | $14,240 | $65,240 |
| 2024 | $636 | $79,320 | $14,240 | $65,080 |
| 2023 | $636 | $78,520 | $14,240 | $64,280 |
| 2022 | $535 | $69,720 | $14,240 | $55,480 |
| 2021 | $535 | $48,960 | $3,800 | $45,160 |
| 2020 | $341 | $12,920 | $1,240 | $11,680 |
| 2019 | $897 | $32,680 | $3,800 | $28,880 |
| 2018 | $1,592 | $31,240 | $3,800 | $27,440 |
| 2017 | $1,664 | $26,360 | $3,800 | $22,560 |
| 2016 | $1,493 | $26,080 | $3,800 | $22,280 |
| 2014 | $1,214 | $19,280 | $3,800 | $15,480 |
Source: Public Records
Map
Nearby Homes
- 6182 Saint Charles Ct
- 6126 Marbut Rd Unit II
- 1882 Corners Cir
- 6202 Saint Christophers Ct
- 6185 Marbut Farms Chase
- 2039 Raintree Place
- 6082 Raintree Bend
- 6260 Marbut Farms Terrace
- 2123 Lown Farm Ln
- 2211 Jonathan Ave
- 2285 Cherokee Valley Cir Unit III
- 2067 Raintree Place
- 6248 Marbut Farms Ln
- 2191 Phillips Rd
- 6047 Marbut Rd
- 2045 Lown Farm Trail Unit 3
- 2293 Cherokee Valley Dr Unit 3
- 2128 Tiffany Ln
- 6240 Giles Rd
- 2247 Cherokee Valley Dr
- 6165 Saint Charles Ct
- 6171 Saint Charles Ct
- 2119 Victoria Place
- 6175 Saint Charles Ct
- 2123 Victoria Place
- 6162 Saint Charles Ct
- 6166 Saint Charles Ct
- 6166 St Charles Ct
- 2104 Victoria Place
- 0 Marbut Rd Unit 7098286
- 0 Marbut Rd Unit 8437604
- 0 Marbut Rd Unit 8245873
- 0 Marbut Rd Unit 8091028
- 0 Marbut Rd Unit 7600134
- 0 Marbut Rd Unit 8322893
- 0 Marbut Rd Unit 7013157
- 0 Marbut Rd Unit 3202868
- 0 Marbut Rd Unit 8535572
- 0 Marbut Rd Unit 8077976
- 0 Marbut Rd Unit 7379399