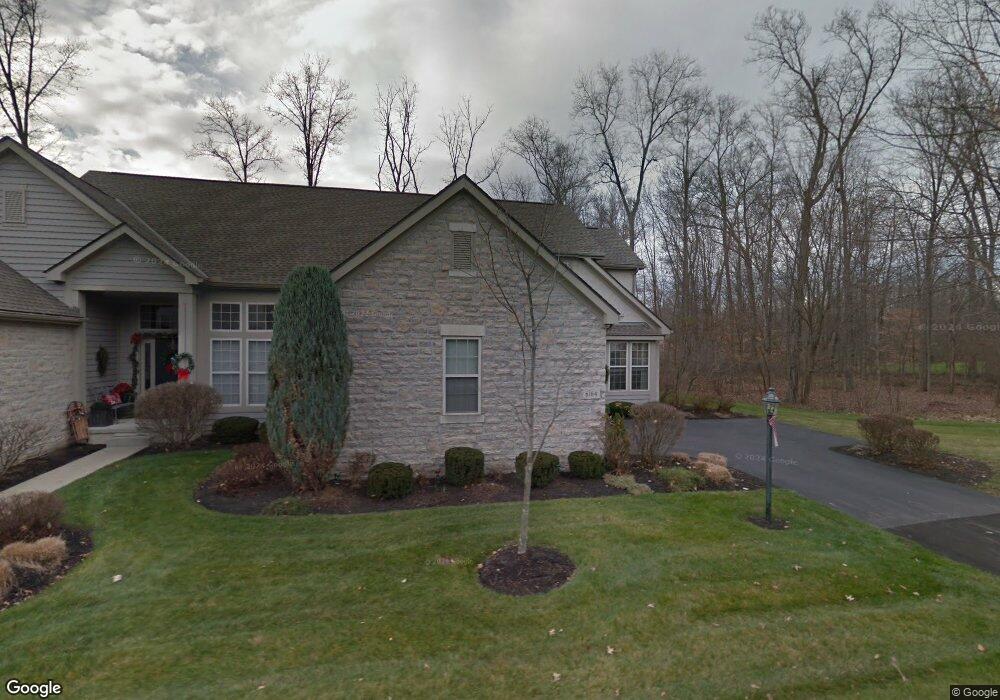
6164 Langton Cir Unit 6164 Westerville, OH 43082
Genoa NeighborhoodEstimated Value: $507,219 - $556,000
3
Beds
3
Baths
2,423
Sq Ft
$222/Sq Ft
Est. Value
About This Home
This home is located at 6164 Langton Cir Unit 6164, Westerville, OH 43082 and is currently estimated at $537,805, approximately $221 per square foot. 6164 Langton Cir Unit 6164 is a home located in Delaware County with nearby schools including Alcott Elementary School, Genoa Middle School, and Westerville Central High School.
Ownership History
Date
Name
Owned For
Owner Type
Purchase Details
Closed on
Jun 15, 2007
Sold by
Semersky Richard J
Bought by
Mceaneney Shannon L
Current Estimated Value
Purchase Details
Closed on
Dec 3, 2004
Sold by
Sobel Martin and Sobel Rose M
Bought by
Semersky Richard J and Mceaneney Shannon L
Home Financials for this Owner
Home Financials are based on the most recent Mortgage that was taken out on this home.
Original Mortgage
$255,000
Interest Rate
5.77%
Mortgage Type
Purchase Money Mortgage
Purchase Details
Closed on
Oct 31, 2003
Sold by
Mercer Michael J and Mercer Connie S
Bought by
Sobel Martin and Sobel Rose M
Purchase Details
Closed on
Oct 17, 2001
Sold by
Davidson Webb Ventures
Bought by
Mercer Michael J and Mercer Connie S
Home Financials for this Owner
Home Financials are based on the most recent Mortgage that was taken out on this home.
Original Mortgage
$168,000
Interest Rate
6.92%
Mortgage Type
New Conventional
Create a Home Valuation Report for This Property
The Home Valuation Report is an in-depth analysis detailing your home's value as well as a comparison with similar homes in the area
Home Values in the Area
Average Home Value in this Area
Purchase History
| Date | Buyer | Sale Price | Title Company |
|---|---|---|---|
| Mceaneney Shannon L | -- | None Available | |
| Semersky Richard J | $330,000 | Multiple | |
| Sobel Martin | $324,900 | -- | |
| Mercer Michael J | $289,256 | -- |
Source: Public Records
Mortgage History
| Date | Status | Borrower | Loan Amount |
|---|---|---|---|
| Previous Owner | Semersky Richard J | $255,000 | |
| Previous Owner | Mercer Michael J | $168,000 |
Source: Public Records
Tax History Compared to Growth
Tax History
| Year | Tax Paid | Tax Assessment Tax Assessment Total Assessment is a certain percentage of the fair market value that is determined by local assessors to be the total taxable value of land and additions on the property. | Land | Improvement |
|---|---|---|---|---|
| 2024 | $7,658 | $146,520 | $30,980 | $115,540 |
| 2023 | $7,430 | $146,520 | $30,980 | $115,540 |
| 2022 | $8,112 | $123,130 | $22,750 | $100,380 |
| 2021 | $8,193 | $123,130 | $22,750 | $100,380 |
| 2020 | $8,243 | $123,130 | $22,750 | $100,380 |
| 2019 | $8,252 | $118,340 | $22,750 | $95,590 |
| 2018 | $8,000 | $118,340 | $22,750 | $95,590 |
| 2017 | $7,663 | $103,880 | $17,500 | $86,380 |
| 2016 | $7,552 | $103,880 | $17,500 | $86,380 |
| 2015 | $7,491 | $103,880 | $17,500 | $86,380 |
| 2014 | $7,400 | $103,880 | $17,500 | $86,380 |
| 2013 | $7,063 | $99,750 | $17,500 | $82,250 |
Source: Public Records
Map
Nearby Homes
- 8357 Danbridge Way
- 7663 Rolling Ridge Way
- 6460 Bromfield Dr
- 7455 Rolling Ridge Way
- 5840 Heron Ct
- 7524 Center Green Dr
- 6618 Wild Rose Ln
- 7581 Lanetta Ln
- 6639 Meadow Glen Dr S
- 5695 Medallion Dr E
- 6050 Medallion Dr W
- 7268 Clancy Way
- 7031 Ellison Dr
- 6086 Hemingway Place
- 7356 Park Bend Dr
- 7553 Slane Ridge Dr
- 5739 Mist Flower Ln
- 5560 Wild Pine Dr
- 8183 Chateau Ln
- 6867 Sherbrook Dr
- 6174 Langton Cir Unit 6174
- 6178 Langton Cir
- 6158 Langton Cir
- 6143 Langton Cir Unit 6143
- 6190 Langton Cir
- 6146 Langton Cir
- 6129 Langton Cir Unit 6129
- 6179 Langton Cir
- 6199 Beringer Dr
- 6211 Beringer Dr
- 6191 Langton Cir
- 6187 Beringer Dr
- 6194 Langton Cir
- 6227 Beringer Dr
- 6206 Langton Cir Unit 6206
- 6142 Langton Cir
- 6107 Langton Cir
- 6175 Beringer Dr
- 8070 Rookery Way
- 6207 Langton Cir Unit 6207