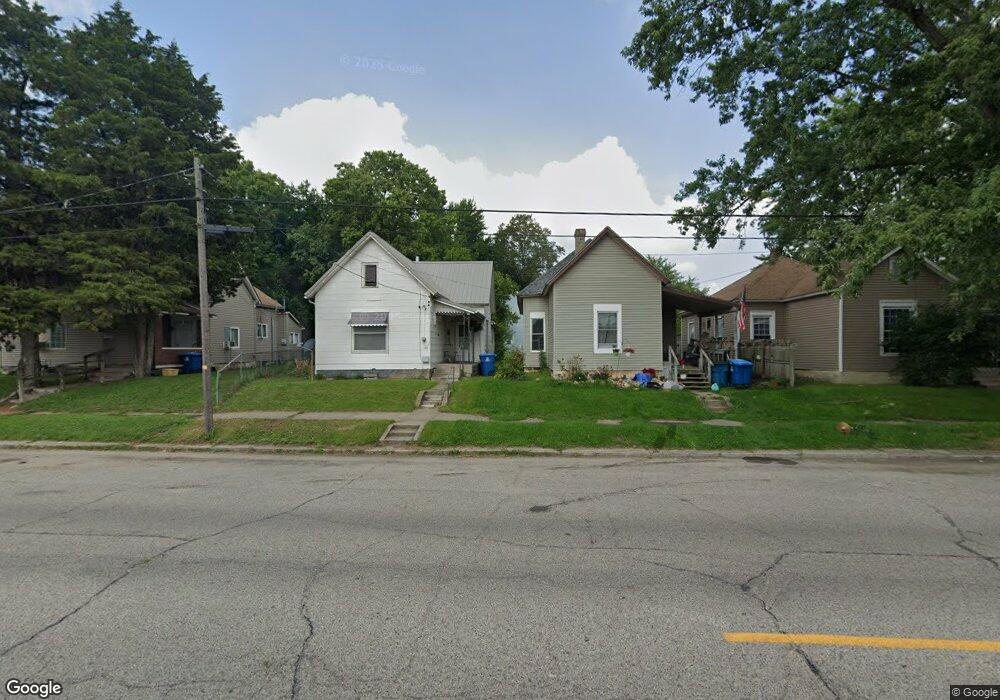
617 11th St Logansport, IN 46947
Estimated Value: $91,000 - $129,680
4
Beds
1
Bath
1,888
Sq Ft
$59/Sq Ft
Est. Value
About This Home
This home is located at 617 11th St, Logansport, IN 46947 and is currently estimated at $110,670, approximately $58 per square foot. 617 11th St is a home located in Cass County with nearby schools including Logansport Community High School and All Saints Catholic School.
Ownership History
Date
Name
Owned For
Owner Type
Purchase Details
Closed on
Aug 26, 2010
Sold by
Stonecrest Income & Opportunity Fun Llc
Bought by
Miguel De Miguel Juan
Current Estimated Value
Purchase Details
Closed on
Dec 3, 2009
Sold by
Frank Kahl Managing M
Bought by
Jon Freeman
Purchase Details
Closed on
Nov 18, 2009
Sold by
Gene L Isaacs
Bought by
James G Lauck Attorney
Create a Home Valuation Report for This Property
The Home Valuation Report is an in-depth analysis detailing your home's value as well as a comparison with similar homes in the area
Home Values in the Area
Average Home Value in this Area
Purchase History
| Date | Buyer | Sale Price | Title Company |
|---|---|---|---|
| Miguel De Miguel Juan | $5,800 | Siof | |
| Jon Freeman | $7,000 | Blue Spruce Entities, Llc | |
| Frank Kahl Managing M | $4,000 | Blue Spruce Entities, Llc | |
| James G Lauck Attorney | $11,700 | Kroger Gardis & Regas, Llp |
Source: Public Records
Tax History Compared to Growth
Tax History
| Year | Tax Paid | Tax Assessment Tax Assessment Total Assessment is a certain percentage of the fair market value that is determined by local assessors to be the total taxable value of land and additions on the property. | Land | Improvement |
|---|---|---|---|---|
| 2024 | $570 | $63,300 | $9,900 | $53,400 |
| 2023 | $570 | $56,800 | $9,900 | $46,900 |
| 2022 | $527 | $52,500 | $9,900 | $42,600 |
| 2021 | $480 | $47,800 | $9,900 | $37,900 |
| 2020 | $418 | $41,600 | $9,900 | $31,700 |
| 2019 | $404 | $40,200 | $9,900 | $30,300 |
| 2018 | $386 | $38,400 | $10,000 | $28,400 |
| 2017 | $386 | $38,400 | $11,700 | $26,700 |
| 2016 | $711 | $35,500 | $11,700 | $23,800 |
| 2014 | $789 | $39,400 | $11,700 | $27,700 |
| 2013 | $789 | $40,300 | $11,800 | $28,500 |
Source: Public Records
Map
Nearby Homes