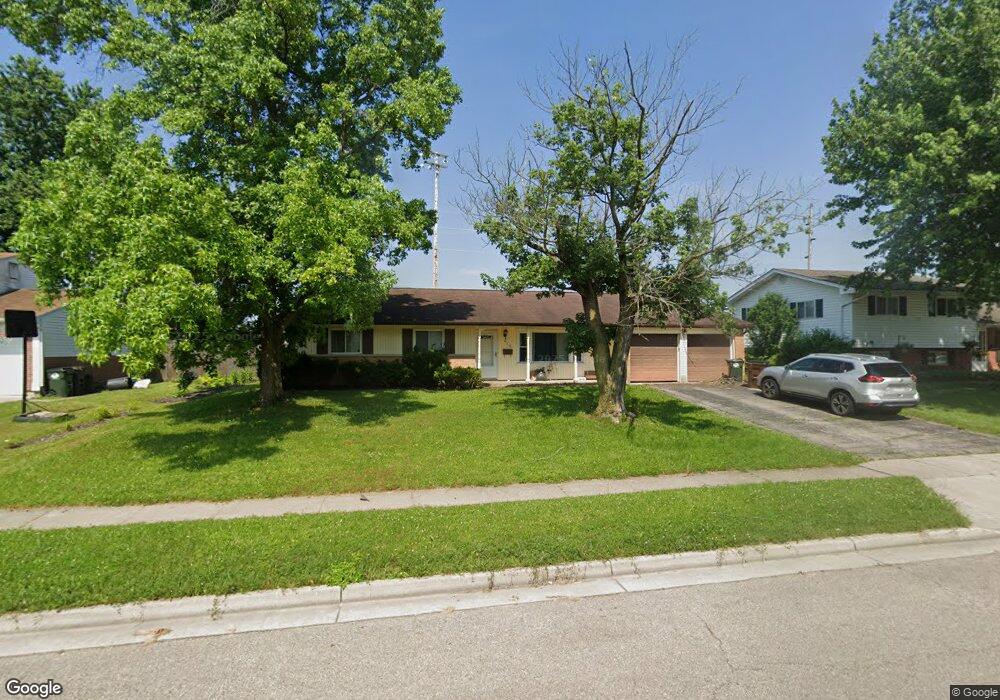
617 Bennert Dr Vandalia, OH 45377
Estimated Value: $204,000 - $267,000
3
Beds
2
Baths
1,645
Sq Ft
$147/Sq Ft
Est. Value
About This Home
This home is located at 617 Bennert Dr, Vandalia, OH 45377 and is currently estimated at $241,467, approximately $146 per square foot. 617 Bennert Dr is a home located in Montgomery County with nearby schools including Demmitt Elementary School, Smith Middle School, and Butler High School.
Ownership History
Date
Name
Owned For
Owner Type
Purchase Details
Closed on
Aug 18, 2020
Sold by
Wendling Edward P and Wendling Edward
Bought by
Nomada Ventures Llc
Current Estimated Value
Home Financials for this Owner
Home Financials are based on the most recent Mortgage that was taken out on this home.
Original Mortgage
$1,105
Interest Rate
6.25%
Mortgage Type
Land Contract Argmt. Of Sale
Purchase Details
Closed on
Dec 30, 2010
Sold by
U S Bank National Association
Bought by
Wendling Edward
Purchase Details
Closed on
Oct 15, 2010
Sold by
Shook Jennifer J and Shook Bradley M
Bought by
U S Bank National Association
Purchase Details
Closed on
Feb 16, 1999
Sold by
Smith Gail S
Bought by
Shook Bradley M and Shook Jennifer J
Home Financials for this Owner
Home Financials are based on the most recent Mortgage that was taken out on this home.
Original Mortgage
$104,946
Interest Rate
6.88%
Mortgage Type
FHA
Create a Home Valuation Report for This Property
The Home Valuation Report is an in-depth analysis detailing your home's value as well as a comparison with similar homes in the area
Home Values in the Area
Average Home Value in this Area
Purchase History
| Date | Buyer | Sale Price | Title Company |
|---|---|---|---|
| Nomada Ventures Llc | $100,000 | None Available | |
| Wendling Edward | $65,000 | Attorney | |
| U S Bank National Association | $68,000 | Attorney | |
| Shook Bradley M | $105,000 | -- |
Source: Public Records
Mortgage History
| Date | Status | Borrower | Loan Amount |
|---|---|---|---|
| Closed | Nomada Ventures Llc | $1,105 | |
| Previous Owner | Shook Bradley M | $104,946 |
Source: Public Records
Tax History Compared to Growth
Tax History
| Year | Tax Paid | Tax Assessment Tax Assessment Total Assessment is a certain percentage of the fair market value that is determined by local assessors to be the total taxable value of land and additions on the property. | Land | Improvement |
|---|---|---|---|---|
| 2024 | $3,165 | $59,170 | $16,910 | $42,260 |
| 2023 | $3,165 | $59,170 | $16,910 | $42,260 |
| 2022 | $2,682 | $40,530 | $11,580 | $28,950 |
| 2021 | $2,685 | $40,530 | $11,580 | $28,950 |
| 2020 | $2,677 | $40,530 | $11,580 | $28,950 |
| 2019 | $2,222 | $30,790 | $11,580 | $19,210 |
| 2018 | $2,226 | $30,790 | $11,580 | $19,210 |
| 2017 | $2,211 | $30,790 | $11,580 | $19,210 |
| 2016 | $2,061 | $28,870 | $11,580 | $17,290 |
| 2015 | $2,479 | $28,870 | $11,580 | $17,290 |
| 2014 | $2,479 | $35,230 | $11,580 | $23,650 |
| 2012 | -- | $28,160 | $11,570 | $16,590 |
Source: Public Records
Map
Nearby Homes
- 461 Poplar Grove Dr
- 552 Tionda Dr N
- 416 Attica St
- 1182 Park Forest Dr
- 106 Grosbeck St
- 416 Bent Twig Dr
- 469 Farrell Rd
- 545 Koch Ave
- 314 N American Blvd
- 76 Farrell Rd
- 485 Pilot Point Unit 1-301
- 214 Marview Ave
- 92 Waller Ave
- 775 Cassel Creek Dr
- 465 Pilot Point Unit 1-302
- 626 W National Rd
- 475 Pilot Point Unit 1-300
- 696 W Alkaline Springs Rd
- 847 Waldsmith Way
- 365 Inverness Ave
- 701 Bennert Dr
- 609 Bennert Dr
- 709 Bennert Dr
- 601 Bennert Dr
- 620 Bennert Dr
- 704 Bennert Dr
- 602 Bennert Dr
- 717 Bennert Dr
- 535 Bennert Dr
- 712 Bennert Dr
- 536 Bennert Dr
- 319 E Alkaline Springs Rd
- 527 Bennert Dr
- 629 Lancer Ave
- 621 Lancer Ave
- 333 E Alkaline Springs Rd
- 705 Lancer Ave
- 613 Lancer Ave
- 528 Bennert Dr
- 711 Lancer Ave