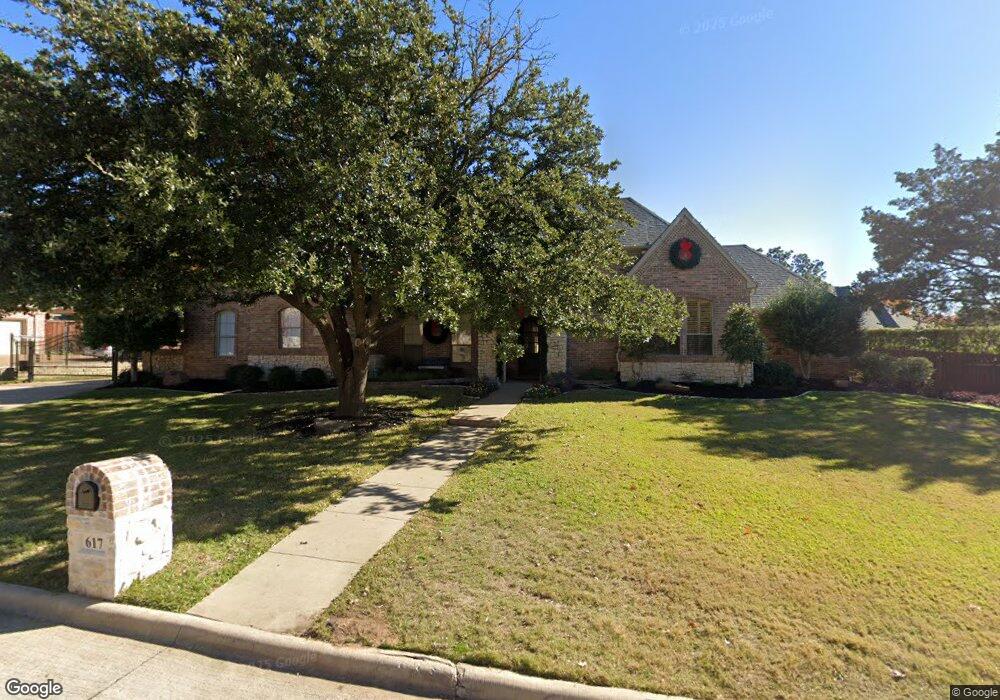
617 Bordeaux Dr Southlake, TX 76092
Estimated Value: $1,352,000 - $1,592,000
4
Beds
4
Baths
4,752
Sq Ft
$317/Sq Ft
Est. Value
About This Home
This home is located at 617 Bordeaux Dr, Southlake, TX 76092 and is currently estimated at $1,504,784, approximately $316 per square foot. 617 Bordeaux Dr is a home located in Tarrant County with nearby schools including Old Union Elementary School, Eubanks Intermediate School, and George Dawson Middle School.
Ownership History
Date
Name
Owned For
Owner Type
Purchase Details
Closed on
Sep 1, 2022
Sold by
Nielsen Mark
Bought by
Sojourning Servants Trust
Current Estimated Value
Purchase Details
Closed on
Jun 27, 2022
Sold by
Bryan Votaw Timothy
Bought by
Nielsen Mark and Nielsen Maria
Home Financials for this Owner
Home Financials are based on the most recent Mortgage that was taken out on this home.
Original Mortgage
$350,000
Interest Rate
4.48%
Mortgage Type
New Conventional
Purchase Details
Closed on
May 24, 2000
Sold by
Benco Homes Inc
Bought by
Votaw Timothy Bryan and Votaw Mary Jo
Home Financials for this Owner
Home Financials are based on the most recent Mortgage that was taken out on this home.
Original Mortgage
$376,000
Interest Rate
7.62%
Purchase Details
Closed on
Mar 19, 1999
Sold by
Versailles Ltd
Bought by
Benco Homes Inc
Create a Home Valuation Report for This Property
The Home Valuation Report is an in-depth analysis detailing your home's value as well as a comparison with similar homes in the area
Home Values in the Area
Average Home Value in this Area
Purchase History
| Date | Buyer | Sale Price | Title Company |
|---|---|---|---|
| Sojourning Servants Trust | -- | -- | |
| Nielsen Mark | -- | None Listed On Document | |
| Votaw Timothy Bryan | -- | Chicago Title Insurance Co | |
| Benco Homes Inc | -- | Safeco Land Title |
Source: Public Records
Mortgage History
| Date | Status | Borrower | Loan Amount |
|---|---|---|---|
| Previous Owner | Nielsen Mark | $350,000 | |
| Previous Owner | Votaw Timothy Bryan | $376,000 |
Source: Public Records
Tax History Compared to Growth
Tax History
| Year | Tax Paid | Tax Assessment Tax Assessment Total Assessment is a certain percentage of the fair market value that is determined by local assessors to be the total taxable value of land and additions on the property. | Land | Improvement |
|---|---|---|---|---|
| 2025 | $25,386 | $1,323,208 | $322,425 | $1,000,783 |
| 2024 | $25,386 | $1,365,027 | $322,425 | $1,042,602 |
| 2023 | $27,982 | $1,535,216 | $322,425 | $1,212,791 |
| 2022 | $17,367 | $1,137,767 | $214,950 | $922,817 |
| 2021 | $16,685 | $815,000 | $214,950 | $600,050 |
| 2020 | $15,292 | $665,285 | $193,455 | $471,830 |
| 2019 | $20,402 | $896,154 | $150,000 | $746,154 |
| 2018 | $17,518 | $765,960 | $150,000 | $615,960 |
| 2017 | $18,470 | $745,170 | $150,000 | $595,170 |
| 2016 | $18,472 | $745,243 | $150,000 | $595,243 |
| 2015 | $16,111 | $732,161 | $90,000 | $642,161 |
| 2014 | $16,111 | $664,200 | $90,000 | $574,200 |
Source: Public Records
Map
Nearby Homes
- 1401 Chardonnay Ct
- 1012 Cool River Dr
- 702 Sussex Ct
- 1100 La Paloma Ct
- 1304 Kings Brook Ct
- 223 Westwood Dr
- 1206 Timberline Ct
- 710 Longford Dr
- 708 Nettleton Dr
- 1719 Byron Nelson Pkwy
- 712 Ashleigh Ln
- 1420 Kensington Ct
- 1032 Rosavine Dr
- 1028 Rosavine Dr
- 1017 Rosavine Dr
- 1004 Rosavine Dr
- 1020 Rosavine Dr
- 1012 Rosavine Dr
- 1024 Rosavine Dr
- 1005 Rosavine Dr
- 1201 Marquette Ct
- 1200 Lorraine Ct
- 1202 Lorraine Ct
- 1203 Marquette Ct
- 616 Bordeaux Dr
- 1204 Lorraine Ct
- 614 Bordeaux Dr
- 618 Bordeaux Dr
- 709 Lorraine Dr
- 612 Bordeaux Dr
- 1206 Lorraine Ct
- 1204 Marquette Ct
- 703 Verdun Ct
- 1203 Lorraine Ct
- 1107 Calais Dr
- 1200 Marquette Ct
- 707 Lorraine Dr
- 610 Bordeaux Dr
- 1205 Lorraine Ct
- 1202 Marquette Ct