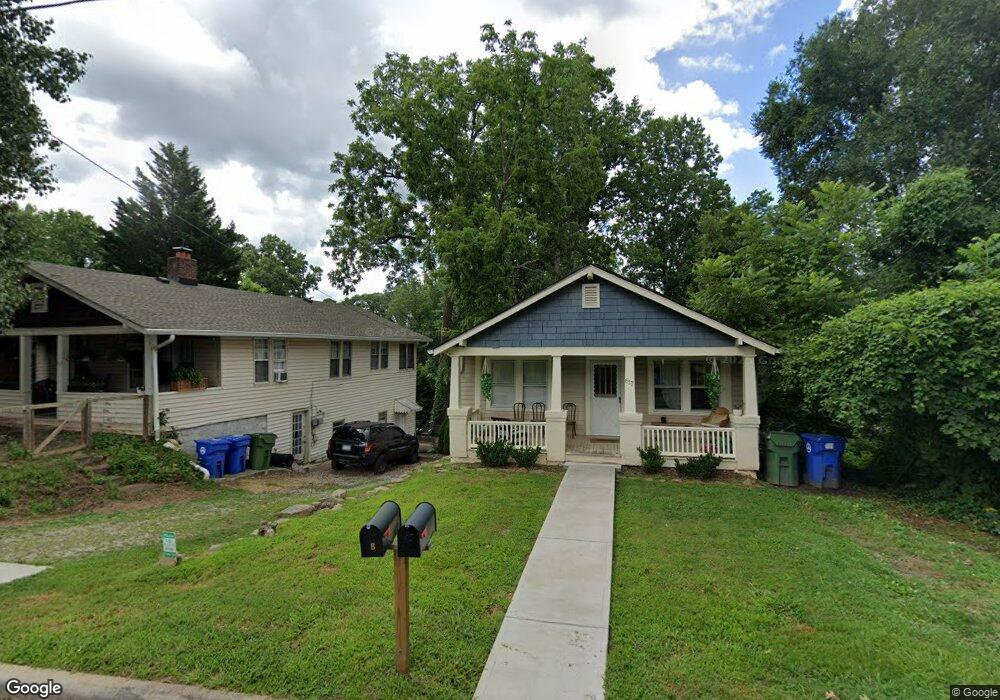
617 Brookshire St Asheville, NC 28803
Estimated Value: $289,000 - $350,000
3
Beds
2
Baths
962
Sq Ft
$341/Sq Ft
Est. Value
About This Home
This home is located at 617 Brookshire St, Asheville, NC 28803 and is currently estimated at $328,340, approximately $341 per square foot. 617 Brookshire St is a home located in Buncombe County with nearby schools including T.C. Roberson High School, William W. Estes Elementary School, and Koontz Intermediate School.
Ownership History
Date
Name
Owned For
Owner Type
Purchase Details
Closed on
Dec 22, 2020
Sold by
Turner Gregory S
Bought by
161 Logan Llc
Current Estimated Value
Home Financials for this Owner
Home Financials are based on the most recent Mortgage that was taken out on this home.
Original Mortgage
$130,000
Outstanding Balance
$41,739
Interest Rate
2.7%
Mortgage Type
Commercial
Estimated Equity
$286,601
Purchase Details
Closed on
May 6, 1998
Sold by
Turner Henriette N
Bought by
Turner Gregory S
Create a Home Valuation Report for This Property
The Home Valuation Report is an in-depth analysis detailing your home's value as well as a comparison with similar homes in the area
Home Values in the Area
Average Home Value in this Area
Purchase History
| Date | Buyer | Sale Price | Title Company |
|---|---|---|---|
| 161 Logan Llc | $180,000 | None Available | |
| Turner Gregory S | -- | -- |
Source: Public Records
Mortgage History
| Date | Status | Borrower | Loan Amount |
|---|---|---|---|
| Open | 161 Logan Llc | $130,000 | |
| Closed | 161 Logan Llc | $120,000 |
Source: Public Records
Tax History Compared to Growth
Tax History
| Year | Tax Paid | Tax Assessment Tax Assessment Total Assessment is a certain percentage of the fair market value that is determined by local assessors to be the total taxable value of land and additions on the property. | Land | Improvement |
|---|---|---|---|---|
| 2025 | $1,863 | $199,800 | $51,400 | $148,400 |
| 2024 | $1,863 | $199,800 | $51,400 | $148,400 |
| 2023 | $1,863 | $199,800 | $51,400 | $148,400 |
| 2022 | $1,780 | $199,800 | $0 | $0 |
| 2021 | $1,780 | $199,800 | $0 | $0 |
| 2020 | $1,447 | $150,500 | $0 | $0 |
| 2019 | $1,447 | $150,500 | $0 | $0 |
| 2018 | $1,447 | $150,500 | $0 | $0 |
| 2017 | $1,459 | $123,600 | $0 | $0 |
| 2016 | $1,336 | $123,600 | $0 | $0 |
| 2015 | $1,336 | $123,600 | $0 | $0 |
| 2014 | $1,317 | $123,600 | $0 | $0 |
Source: Public Records
Map
Nearby Homes