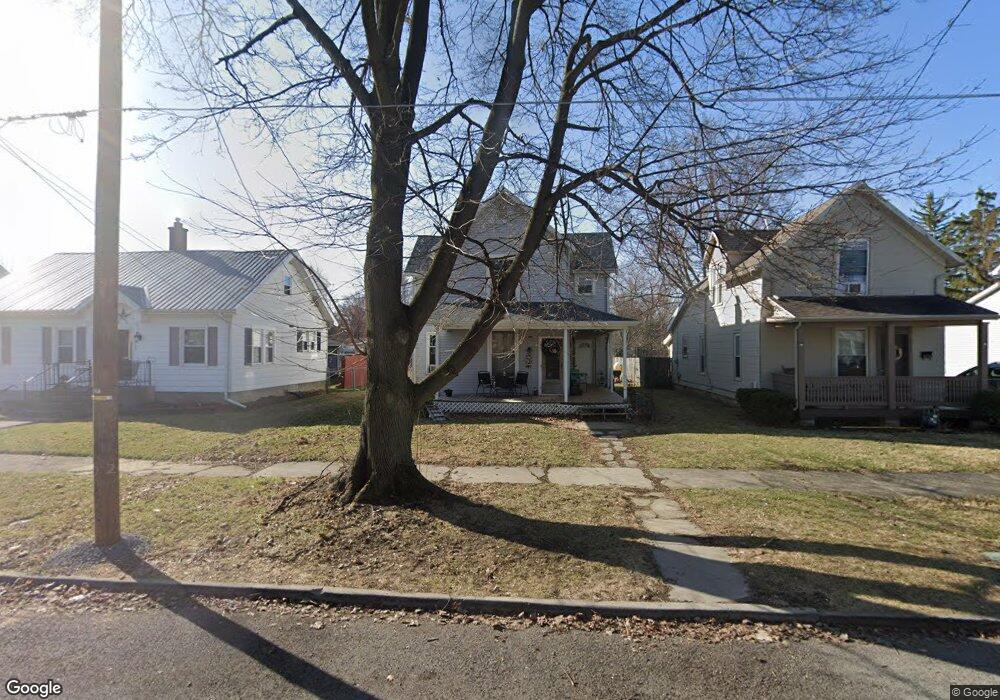
617 Center St Findlay, OH 45840
Estimated Value: $124,000 - $147,038
3
Beds
2
Baths
2,000
Sq Ft
$69/Sq Ft
Est. Value
About This Home
This home is located at 617 Center St, Findlay, OH 45840 and is currently estimated at $138,010, approximately $69 per square foot. 617 Center St is a home located in Hancock County with nearby schools including Whittier Elementary School, Wilson Vance Elementary School, and Donnell Middle School.
Ownership History
Date
Name
Owned For
Owner Type
Purchase Details
Closed on
Jan 20, 2021
Sold by
Enforce Enterprises Corp
Bought by
Reiter Holdings Llc
Current Estimated Value
Purchase Details
Closed on
Nov 20, 2019
Sold by
Enforce Enterprises Corp Inc
Bought by
Reiter Holdings Llc
Home Financials for this Owner
Home Financials are based on the most recent Mortgage that was taken out on this home.
Original Mortgage
$40,000
Interest Rate
3.75%
Mortgage Type
Land Contract Argmt. Of Sale
Purchase Details
Closed on
Jan 27, 1994
Bought by
Barringer Susan L
Purchase Details
Closed on
Aug 2, 1990
Bought by
Barringer Eric L
Purchase Details
Closed on
Aug 28, 1987
Bought by
Barringer Eric L
Purchase Details
Closed on
Sep 18, 1985
Bought by
Wells David P
Purchase Details
Closed on
Jan 26, 1983
Bought by
Abbott Associates
Create a Home Valuation Report for This Property
The Home Valuation Report is an in-depth analysis detailing your home's value as well as a comparison with similar homes in the area
Home Values in the Area
Average Home Value in this Area
Purchase History
| Date | Buyer | Sale Price | Title Company |
|---|---|---|---|
| Reiter Holdings Llc | $40,000 | Legacy Title Llc | |
| Reiter Holdings Llc | $40,000 | None Available | |
| Barringer Susan L | -- | -- | |
| Barringer Eric L | -- | -- | |
| Barringer Eric L | $45,800 | -- | |
| Wells David P | $34,800 | -- | |
| Abbott Associates | $39,500 | -- |
Source: Public Records
Mortgage History
| Date | Status | Borrower | Loan Amount |
|---|---|---|---|
| Previous Owner | Reiter Holdings Llc | $40,000 |
Source: Public Records
Tax History Compared to Growth
Tax History
| Year | Tax Paid | Tax Assessment Tax Assessment Total Assessment is a certain percentage of the fair market value that is determined by local assessors to be the total taxable value of land and additions on the property. | Land | Improvement |
|---|---|---|---|---|
| 2024 | $1,324 | $36,310 | $5,180 | $31,130 |
| 2023 | $1,326 | $36,310 | $5,180 | $31,130 |
| 2022 | $1,321 | $36,310 | $5,180 | $31,130 |
| 2021 | $1,163 | $27,840 | $5,450 | $22,390 |
| 2020 | $1,163 | $27,840 | $5,450 | $22,390 |
| 2019 | $1,140 | $27,840 | $5,450 | $22,390 |
| 2018 | $1,084 | $24,290 | $4,740 | $19,550 |
| 2017 | $1,084 | $24,290 | $4,740 | $19,550 |
| 2016 | $1,080 | $24,290 | $4,740 | $19,550 |
| 2015 | $902 | $20,050 | $4,740 | $15,310 |
| 2014 | $902 | $20,050 | $4,740 | $15,310 |
| 2012 | $1,052 | $23,200 | $4,740 | $18,460 |
Source: Public Records
Map
Nearby Homes
- 523 Center St
- 545 Clinton Ct
- 210 Eastowne Park Row
- 247 Crystal Ave
- 213 Cherry St
- 207 Ash Ave
- 0 Canadian Way Unit 20253551
- 0 Canadian Way Unit 6135400
- 1001 Decker Ave
- 1320 Glen Rd
- 309 Huron Rd
- 716 Winfield Ave
- 512 N Cory St
- 706 N Cory St
- 224 Defiance Ave
- 820 Selby St
- 619 Fishlock Ave
- 15591 Canadian Way
- 15586 Canadian Way
- 15615 Canadian Way