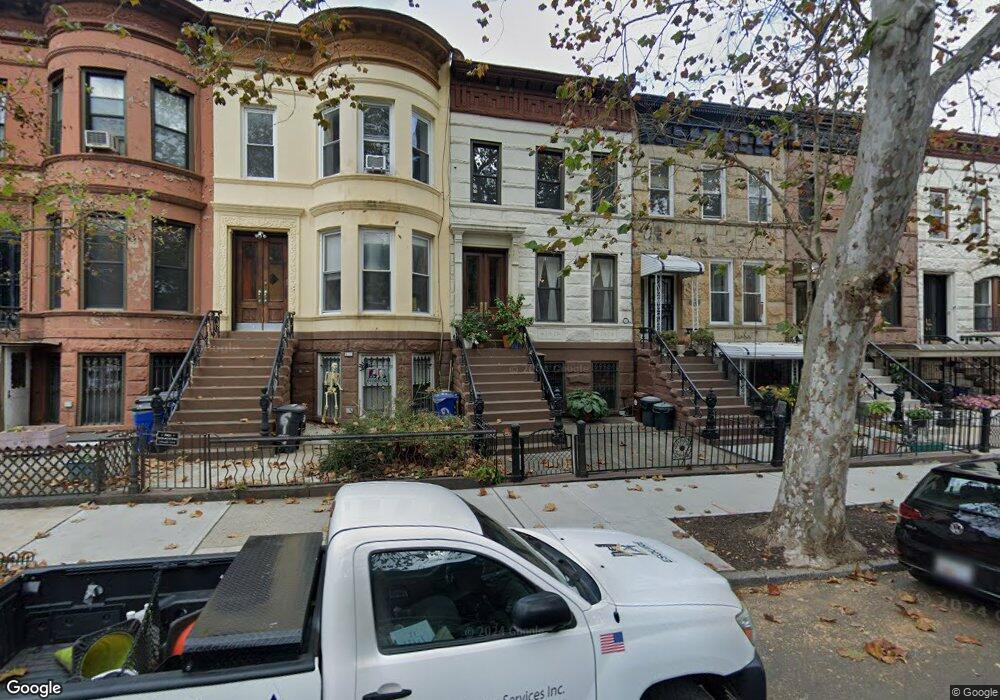
617 Decatur St Brooklyn, NY 11233
Bed-Stuy NeighborhoodEstimated Value: $1,371,000 - $1,758,000
4
Beds
--
Bath
2,310
Sq Ft
$675/Sq Ft
Est. Value
About This Home
This home is located at 617 Decatur St, Brooklyn, NY 11233 and is currently estimated at $1,558,706, approximately $674 per square foot. 617 Decatur St is a home located in Kings County with nearby schools including P.S. 40 George W Carver, Ocean Hill Collegiate Charter School, and Achievement First Bushwick Charter School.
Ownership History
Date
Name
Owned For
Owner Type
Purchase Details
Closed on
Oct 18, 2007
Sold by
Nathanson Beth A and Rittas Kurt V
Bought by
Grier Andrew and Miller Cherlyn
Current Estimated Value
Home Financials for this Owner
Home Financials are based on the most recent Mortgage that was taken out on this home.
Original Mortgage
$496,300
Interest Rate
6.43%
Mortgage Type
Purchase Money Mortgage
Purchase Details
Closed on
Jul 14, 2005
Sold by
Bettis Clementine
Bought by
Nathanson Beth A and Ritta Kurt V
Home Financials for this Owner
Home Financials are based on the most recent Mortgage that was taken out on this home.
Original Mortgage
$49,850
Interest Rate
5.67%
Create a Home Valuation Report for This Property
The Home Valuation Report is an in-depth analysis detailing your home's value as well as a comparison with similar homes in the area
Home Values in the Area
Average Home Value in this Area
Purchase History
| Date | Buyer | Sale Price | Title Company |
|---|---|---|---|
| Grier Andrew | $709,000 | -- | |
| Grier Andrew | $709,000 | -- | |
| Nathanson Beth A | $629,500 | -- | |
| Nathanson Beth A | $629,500 | -- |
Source: Public Records
Mortgage History
| Date | Status | Borrower | Loan Amount |
|---|---|---|---|
| Open | Grier Andrew | $177,150 | |
| Closed | Grier Andrew | $177,150 | |
| Previous Owner | Grier Andrew | $496,300 | |
| Previous Owner | Nathanson Beth A | $49,850 | |
| Previous Owner | Nathanson Beth A | $359,650 |
Source: Public Records
Tax History Compared to Growth
Tax History
| Year | Tax Paid | Tax Assessment Tax Assessment Total Assessment is a certain percentage of the fair market value that is determined by local assessors to be the total taxable value of land and additions on the property. | Land | Improvement |
|---|---|---|---|---|
| 2025 | $5,181 | $101,280 | $18,900 | $82,380 |
| 2024 | $5,181 | $119,160 | $18,900 | $100,260 |
| 2023 | $5,123 | $107,340 | $18,900 | $88,440 |
| 2022 | $4,751 | $101,400 | $18,900 | $82,500 |
| 2021 | $4,725 | $78,300 | $18,900 | $59,400 |
| 2020 | $2,349 | $74,160 | $18,900 | $55,260 |
| 2019 | $4,497 | $81,900 | $18,900 | $63,000 |
| 2018 | $4,285 | $21,020 | $5,954 | $15,066 |
| 2017 | $4,043 | $19,831 | $6,316 | $13,515 |
| 2016 | $3,740 | $18,709 | $7,527 | $11,182 |
| 2015 | $2,256 | $18,709 | $11,290 | $7,419 |
| 2014 | $2,256 | $17,914 | $12,615 | $5,299 |
Source: Public Records
Map
Nearby Homes
- 473 Bainbridge St Unit 1
- 473 Bainbridge St Unit 1-A
- 473 Bainbridge St Unit 2-B
- 479 Bainbridge St
- 479 Bainbridge St Unit Townhouse
- 495 Bainbridge St
- 605 Decatur St
- 686 Macdonough St Unit 3A
- 576 Decatur St
- 364 Chauncey St
- 711 Macdonough St
- 668 Decatur St
- 725 Macdonough St Unit B1B
- 186 Howard Ave
- 794 Macon St
- 206 Howard Ave
- 764 Macon St Unit 4 B
- 397 Bainbridge St
- 315-317 Sumpter St
- 635 Macdonough St
- 615 Decatur St
- 619 Decatur St
- 621 Decatur St
- 613 Decatur St
- 623 Decatur St
- 611 Decatur St
- 625 Decatur St
- 609 Decatur St
- 607 Decatur St
- 627 Decatur St
- 627 Decatur St Unit Building
- 694 Macdonough St
- 692 Macdonough St
- 696 Macdonough St
- 605A Decatur St
- 629 Decatur St
- 698 Macdonough St
- 688 Macdonough St
- 688 Macdonough St Unit Building
- 700 Macdonough St