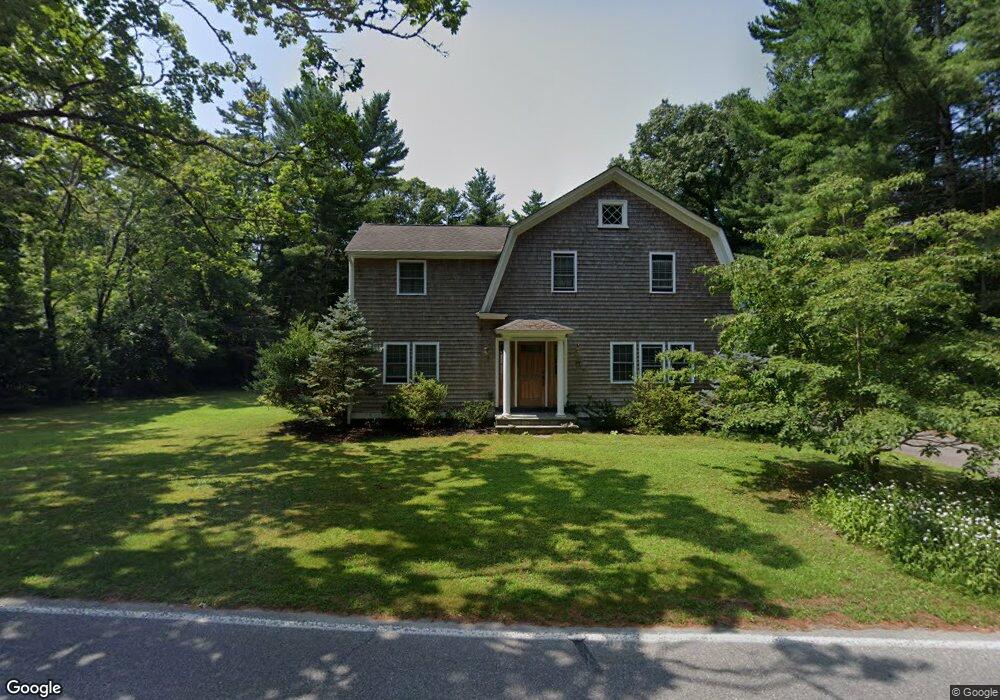
617 Delano Rd Marion, MA 02738
Estimated Value: $692,830 - $873,000
4
Beds
2
Baths
1,910
Sq Ft
$409/Sq Ft
Est. Value
About This Home
This home is located at 617 Delano Rd, Marion, MA 02738 and is currently estimated at $781,708, approximately $409 per square foot. 617 Delano Rd is a home located in Plymouth County with nearby schools including Old Rochester Regional High School and Tabor Academy.
Ownership History
Date
Name
Owned For
Owner Type
Purchase Details
Closed on
Sep 3, 2015
Sold by
Stpierre Diane
Bought by
Stpierre Diane C
Current Estimated Value
Purchase Details
Closed on
Jun 16, 2014
Sold by
Hartley Donald M and Hartley Diane S
Bought by
Hartley Diane S
Purchase Details
Closed on
Apr 29, 2009
Sold by
Brodley Ray D and Flanagan Michael C
Bought by
Hartley Diane S and Hartley Donald M
Home Financials for this Owner
Home Financials are based on the most recent Mortgage that was taken out on this home.
Original Mortgage
$338,735
Interest Rate
4.86%
Mortgage Type
Purchase Money Mortgage
Purchase Details
Closed on
Aug 3, 2007
Sold by
Pruchnik Frank K
Bought by
Brodley Ray D and Flanagan Michael C
Home Financials for this Owner
Home Financials are based on the most recent Mortgage that was taken out on this home.
Original Mortgage
$305,500
Interest Rate
6.73%
Mortgage Type
Purchase Money Mortgage
Purchase Details
Closed on
Jun 2, 2004
Sold by
Pruchnik Virginia E
Bought by
Pruchnik Peter P
Create a Home Valuation Report for This Property
The Home Valuation Report is an in-depth analysis detailing your home's value as well as a comparison with similar homes in the area
Home Values in the Area
Average Home Value in this Area
Purchase History
| Date | Buyer | Sale Price | Title Company |
|---|---|---|---|
| Stpierre Diane C | -- | -- | |
| Hartley Diane S | -- | -- | |
| Hartley Diane S | $369,900 | -- | |
| Brodley Ray D | $210,000 | -- | |
| Pruchnik Peter P | -- | -- |
Source: Public Records
Mortgage History
| Date | Status | Borrower | Loan Amount |
|---|---|---|---|
| Previous Owner | Pruchnik Peter P | $338,735 | |
| Previous Owner | Pruchnik Peter P | $305,500 |
Source: Public Records
Tax History Compared to Growth
Tax History
| Year | Tax Paid | Tax Assessment Tax Assessment Total Assessment is a certain percentage of the fair market value that is determined by local assessors to be the total taxable value of land and additions on the property. | Land | Improvement |
|---|---|---|---|---|
| 2025 | $5,416 | $581,100 | $227,300 | $353,800 |
| 2024 | $4,885 | $527,500 | $227,300 | $300,200 |
| 2023 | $4,524 | $479,200 | $197,700 | $281,500 |
| 2022 | $4,860 | $447,900 | $148,500 | $299,400 |
| 2021 | $4,722 | $417,100 | $131,100 | $286,000 |
| 2020 | $4,338 | $370,800 | $122,300 | $248,500 |
| 2019 | $4,090 | $370,800 | $122,300 | $248,500 |
| 2018 | $3,885 | $339,300 | $117,600 | $221,700 |
| 2017 | $3,871 | $339,300 | $117,600 | $221,700 |
| 2016 | $3,823 | $338,000 | $124,300 | $213,700 |
| 2015 | $4,022 | $362,000 | $124,300 | $237,700 |
Source: Public Records
Map
Nearby Homes
- 929 Point Rd
- 174 Wareham Rd
- 4 Rebecca Dr
- 245 Wareham Rd
- 4 Blackhall Ct
- 11 Joanne Dr
- 26 Washington Dr
- Lot 77E Seahorse
- Lot 77D Seahorse
- 12 Taft St
- 7 Seahorse Way
- 00 Delano Rd
- 5 Hermitage Rd
- 25 Hammetts Cove Rd
- 0 Cromesett Rd (Off) Unit 73385395
- 0 Cross Neck Rd Unit 73420524
- 0 Cross Neck Rd Unit 73420525
- 119 County Rd
- 127 County Rd
- 58 Shady Ln