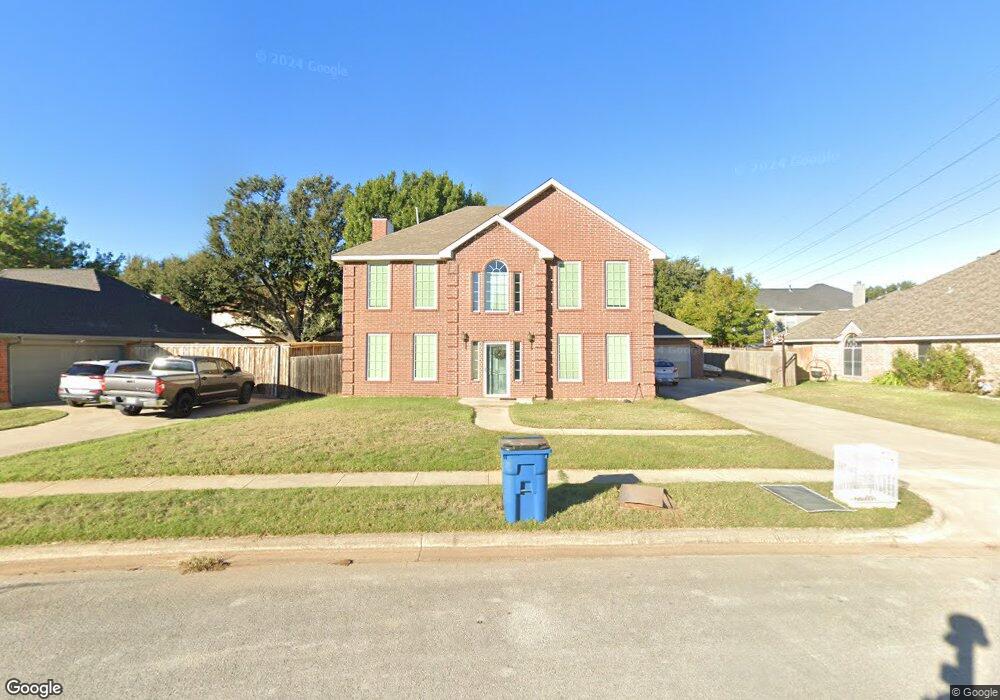
617 Dove Creek Cir Grapevine, TX 76051
Estimated Value: $556,000 - $627,000
3
Beds
2
Baths
2,317
Sq Ft
$254/Sq Ft
Est. Value
About This Home
This home is located at 617 Dove Creek Cir, Grapevine, TX 76051 and is currently estimated at $587,708, approximately $253 per square foot. 617 Dove Creek Cir is a home located in Tarrant County with nearby schools including Silver Lake Elementary School, Grapevine Middle, and Southlake Montessori.
Ownership History
Date
Name
Owned For
Owner Type
Purchase Details
Closed on
Mar 23, 2022
Sold by
Ertel Mark C
Bought by
Ertel Mark C
Current Estimated Value
Purchase Details
Closed on
Apr 14, 1998
Sold by
Long Max and Long Trina
Bought by
Ertel Mark Christopher and Ertel Caren Couch
Home Financials for this Owner
Home Financials are based on the most recent Mortgage that was taken out on this home.
Original Mortgage
$118,800
Interest Rate
7.21%
Purchase Details
Closed on
Oct 28, 1994
Sold by
Gsm Corp
Bought by
Long Max and Long Trina
Home Financials for this Owner
Home Financials are based on the most recent Mortgage that was taken out on this home.
Original Mortgage
$70,000
Interest Rate
8.78%
Purchase Details
Closed on
Aug 12, 1994
Sold by
Vista Partners
Bought by
Gsm Corp
Home Financials for this Owner
Home Financials are based on the most recent Mortgage that was taken out on this home.
Original Mortgage
$114,500
Interest Rate
8.66%
Create a Home Valuation Report for This Property
The Home Valuation Report is an in-depth analysis detailing your home's value as well as a comparison with similar homes in the area
Home Values in the Area
Average Home Value in this Area
Purchase History
| Date | Buyer | Sale Price | Title Company |
|---|---|---|---|
| Ertel Mark C | -- | None Listed On Document | |
| Ertel Mark Christopher | -- | First American Title Co | |
| Long Max | -- | Rattikin Title | |
| Gsm Corp | -- | Rattikin Title Co |
Source: Public Records
Mortgage History
| Date | Status | Borrower | Loan Amount |
|---|---|---|---|
| Previous Owner | Ertel Mark Christopher | $118,800 | |
| Previous Owner | Long Max | $70,000 | |
| Previous Owner | Gsm Corp | $114,500 |
Source: Public Records
Tax History Compared to Growth
Tax History
| Year | Tax Paid | Tax Assessment Tax Assessment Total Assessment is a certain percentage of the fair market value that is determined by local assessors to be the total taxable value of land and additions on the property. | Land | Improvement |
|---|---|---|---|---|
| 2025 | $1,529 | $564,957 | $90,000 | $474,957 |
| 2024 | $1,529 | $564,957 | $90,000 | $474,957 |
| 2023 | $7,114 | $555,317 | $85,000 | $470,317 |
| 2022 | $7,642 | $385,750 | $50,000 | $335,750 |
| 2021 | $8,387 | $385,750 | $50,000 | $335,750 |
| 2020 | $8,085 | $367,578 | $50,000 | $317,578 |
| 2019 | $8,436 | $369,930 | $50,000 | $319,930 |
| 2018 | $1,593 | $341,502 | $50,000 | $291,502 |
| 2017 | $7,263 | $333,938 | $50,000 | $283,938 |
| 2016 | $6,603 | $305,435 | $50,000 | $255,435 |
| 2015 | $5,457 | $259,548 | $35,000 | $224,548 |
| 2014 | $5,457 | $253,900 | $25,000 | $228,900 |
Source: Public Records
Map
Nearby Homes
- 1507 Country Forest Ct
- 517 Yellowstone Dr
- 305 Tillery Cir
- 1201 Circle View Ct
- 2081 Holt Way
- 1508 Bennington Ct
- 2092 Holt Way
- 841 Meadow Bend Loop W
- 2140 S Winding Creek Dr
- 1002 Meadow Bend Loop N
- 1916 Everglade Ct
- 6007 Laurel Ln
- 6011 Laurel Ln
- 2221 Churchill Loop
- 2217 Cameron Crossing
- 1024 Woodbriar Dr
- 1092 Rosewood Dr
- 1626 Choteau Cir
- 1641 Choteau Cir
- 1801 Fern Ct
- 621 Dove Creek Cir
- 556 Dove Creek Place
- 552 Dove Creek Place
- 1509 Thatcher Trail
- 609 Dove Creek Cir
- 618 Dove Creek Cir
- 548 Dove Creek Place
- 614 Dove Creek Cir
- 1505 Thatcher Trail
- 626 Dove Creek Cir
- 605 Dove Creek Cir
- 564 Dove Creek Place
- 544 Dove Creek Place
- 555 Dove Creek Place
- 559 Dove Creek Place
- 1510 Thatcher Trail
- 622 Dove Creek Cir
- 551 Dove Creek Place
- 617 Turtledove Ln
- 563 Dove Creek Place