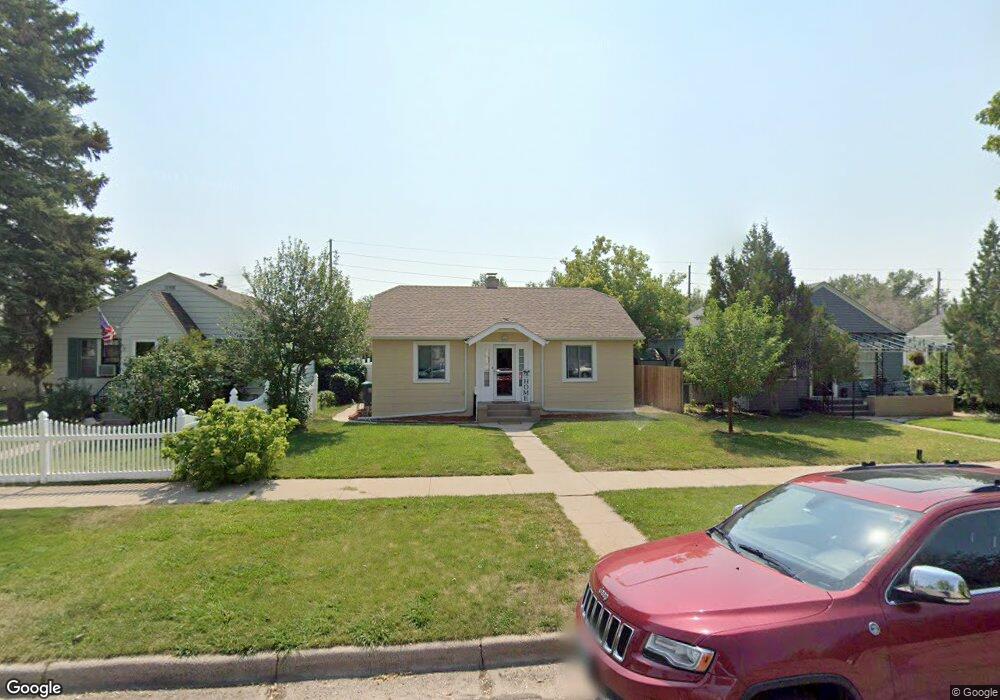
617 E 27th St Cheyenne, WY 82001
Historic Cheyenne NeighborhoodEstimated Value: $282,000 - $380,000
Studio
--
Bath
768
Sq Ft
$408/Sq Ft
Est. Value
About This Home
This home is located at 617 E 27th St, Cheyenne, WY 82001 and is currently estimated at $313,307, approximately $407 per square foot. 617 E 27th St is a home located in Laramie County with nearby schools including Deming Elementary School, Miller Elementary School, and McCormick Junior High School.
Ownership History
Date
Name
Owned For
Owner Type
Purchase Details
Closed on
Sep 30, 2021
Sold by
Carleton Michael A and Sikes Michael
Bought by
Papp Lindsay
Current Estimated Value
Home Financials for this Owner
Home Financials are based on the most recent Mortgage that was taken out on this home.
Original Mortgage
$200,806
Outstanding Balance
$183,116
Interest Rate
2.8%
Mortgage Type
New Conventional
Estimated Equity
$130,191
Purchase Details
Closed on
Jul 31, 2017
Sold by
Trevis Tara Leann
Bought by
Carleton Michael A
Home Financials for this Owner
Home Financials are based on the most recent Mortgage that was taken out on this home.
Original Mortgage
$128,000
Interest Rate
3.91%
Mortgage Type
New Conventional
Purchase Details
Closed on
Aug 23, 2013
Sold by
Bjerke Dale
Bought by
Trevis Tara Leann
Home Financials for this Owner
Home Financials are based on the most recent Mortgage that was taken out on this home.
Original Mortgage
$101,600
Interest Rate
4.53%
Mortgage Type
New Conventional
Create a Home Valuation Report for This Property
The Home Valuation Report is an in-depth analysis detailing your home's value as well as a comparison with similar homes in the area
Home Values in the Area
Average Home Value in this Area
Purchase History
| Date | Buyer | Sale Price | Title Company |
|---|---|---|---|
| Papp Lindsay | -- | First American | |
| Papp Lindsay | -- | First American Title | |
| Carleton Michael A | -- | None Available | |
| Trevis Tara Leann | -- | None Available |
Source: Public Records
Mortgage History
| Date | Status | Borrower | Loan Amount |
|---|---|---|---|
| Open | Papp Lindsay | $200,806 | |
| Closed | Papp Lindsay | $200,806 | |
| Previous Owner | Carleton Michael A | $128,000 | |
| Previous Owner | Trevis Tara Leann | $101,600 |
Source: Public Records
Tax History
| Year | Tax Paid | Tax Assessment Tax Assessment Total Assessment is a certain percentage of the fair market value that is determined by local assessors to be the total taxable value of land and additions on the property. | Land | Improvement |
|---|---|---|---|---|
| 2025 | $1,662 | $18,291 | $2,646 | $15,645 |
| 2024 | $1,662 | $23,501 | $3,528 | $19,973 |
| 2023 | $1,614 | $22,830 | $3,528 | $19,302 |
| 2022 | $1,417 | $19,630 | $3,528 | $16,102 |
| 2021 | $1,312 | $18,132 | $3,528 | $14,604 |
| 2020 | $1,205 | $16,701 | $3,528 | $13,173 |
| 2019 | $1,161 | $16,085 | $3,528 | $12,557 |
| 2018 | $1,054 | $14,736 | $3,065 | $11,671 |
| 2017 | $950 | $13,157 | $3,065 | $10,092 |
| 2016 | $889 | $12,319 | $2,960 | $9,359 |
| 2015 | $916 | $12,675 | $2,960 | $9,715 |
| 2014 | $934 | $12,848 | $2,960 | $9,888 |
Source: Public Records
Map
Nearby Homes
- 600 E 24th St
- 1014 E 25th St Unit 203
- 316 E Pershing Blvd
- 306 E Pershing Blvd
- 414 E 22nd St
- 1008 E 23rd St
- 314 E 2nd Ave
- 1510 Seymour Ave
- 3422 Warren Ave
- 223 E 5th Ave
- 1301 E 23rd St
- 3502 Dunn Ave
- 1018 E 20th St
- 3341 Dunn Ave
- 802 E 18th St
- 1818 Evans Ave Unit 7
- 1818 Evans Ave Unit 308
- 306 E 18th St Unit 307
- 306 E 18th St Unit 102
- 3529 Amherst Rd
Your Personal Tour Guide
Ask me questions while you tour the home.