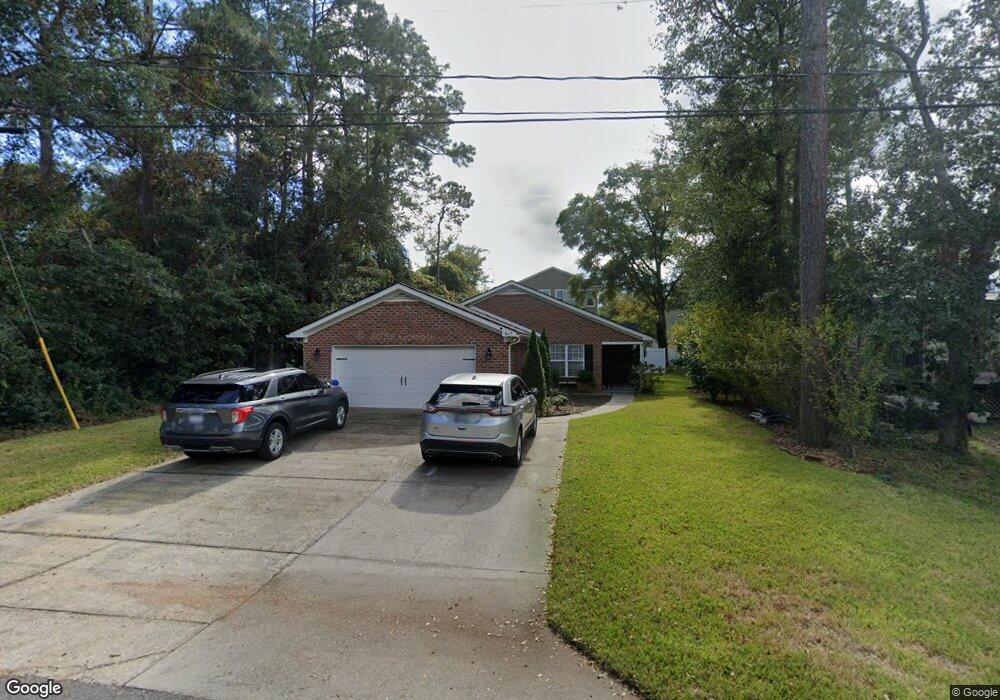
617 Juniper Dr Surfside Beach, SC 29575
Estimated Value: $500,000 - $638,000
3
Beds
2
Baths
1,812
Sq Ft
$318/Sq Ft
Est. Value
About This Home
This home is located at 617 Juniper Dr, Surfside Beach, SC 29575 and is currently estimated at $576,624, approximately $318 per square foot. 617 Juniper Dr is a home located in Horry County with nearby schools including Seaside Elementary, St. James Intermediate, and St. James High School.
Ownership History
Date
Name
Owned For
Owner Type
Purchase Details
Closed on
Jun 12, 2024
Sold by
Fimiani Rosina Susan
Bought by
Colleen Frances Zurawski Living Trust and Zurawski Colleen Frances Tr
Current Estimated Value
Purchase Details
Closed on
Jul 11, 2016
Sold by
Scarbrough Shannon J
Bought by
Fimiani Rosina S
Home Financials for this Owner
Home Financials are based on the most recent Mortgage that was taken out on this home.
Original Mortgage
$140,000
Interest Rate
3.6%
Purchase Details
Closed on
Jun 18, 2015
Sold by
Burke Yolanda and The Fiamingo Legacy Trust
Bought by
Scarbrough Shannon J and Scarbrough Holly A
Home Financials for this Owner
Home Financials are based on the most recent Mortgage that was taken out on this home.
Original Mortgage
$198,000
Interest Rate
3.89%
Mortgage Type
Future Advance Clause Open End Mortgage
Purchase Details
Closed on
Dec 8, 2011
Sold by
Flamingo Frank
Bought by
Burke Yolanda
Create a Home Valuation Report for This Property
The Home Valuation Report is an in-depth analysis detailing your home's value as well as a comparison with similar homes in the area
Home Values in the Area
Average Home Value in this Area
Purchase History
| Date | Buyer | Sale Price | Title Company |
|---|---|---|---|
| Colleen Frances Zurawski Living Trust | $599,000 | -- | |
| Fimiani Rosina S | $240,000 | -- | |
| Scarbrough Shannon J | $220,000 | -- | |
| Burke Yolanda | -- | -- |
Source: Public Records
Mortgage History
| Date | Status | Borrower | Loan Amount |
|---|---|---|---|
| Previous Owner | Fimiani Rosina S | $140,000 | |
| Previous Owner | Scarbrough Shannon J | $198,000 |
Source: Public Records
Tax History
| Year | Tax Paid | Tax Assessment Tax Assessment Total Assessment is a certain percentage of the fair market value that is determined by local assessors to be the total taxable value of land and additions on the property. | Land | Improvement |
|---|---|---|---|---|
| 2025 | $2,538 | $0 | $0 | $0 |
| 2024 | $2,538 | $19,280 | $10,000 | $9,280 |
| 2023 | $1,095 | $10,122 | $4,178 | $5,944 |
| 2021 | $944 | $11,309 | $5,357 | $5,952 |
| 2020 | $924 | $11,309 | $5,357 | $5,952 |
| 2019 | $1,131 | $11,309 | $5,357 | $5,952 |
| 2018 | $0 | $8,802 | $2,774 | $6,028 |
| 2017 | $3,058 | $8,802 | $2,774 | $6,028 |
| 2016 | -- | $8,802 | $2,774 | $6,028 |
| 2015 | $3,058 | $8,802 | $2,774 | $6,028 |
| 2014 | $3,338 | $15,699 | $4,161 | $11,538 |
Source: Public Records
Map
Nearby Homes
- 715 Cypress Dr
- 718 Juniper Dr
- 724 Juniper Dr Unit B
- 726 Juniper Dr
- 616 Maple Dr
- 514 Cypress Dr
- 724 5th Ave S
- 728 7th Ave S Unit SB
- 611 S Palmetto Way
- 714 3rd Ave S
- 417 3rd Ave S
- 21 Palmas Dr
- 617 Surfside Dr
- 327A Lakeside Dr
- 815 S Willow Dr
- 1010 Moss Dr
- 710 1st Ave N Unit C
- 1012 S Hollywood Dr
- 712 S Dogwood Dr Unit 201
- 712 Dogwood Dr S Unit 101
- 617 Juniper Dr
- Lot 14 Juniper Dr
- 616 Cypress Dr
- 616 Cypress Dr Unit B
- 616 Cypress Dr Unit Side A
- 616 Cypress Dr Unit Side B
- TBD Juniper Dr
- 613 Juniper Dr
- 616 Cypress Dr Units A & B
- 616A Cypress Dr Unit SB
- 623 Juniper Dr
- 614 Cypress Dr
- 620 Cypress Dr
- 620 Cypress Dr Unit Lot 8 - Ocean Terrac
- 612 Cypress Dr
- 618 Juniper Dr
- 616 Juniper Dr
- 620 Juniper Dr
- 418 S Hollywood Dr
- 614 Juniper Dr
Your Personal Tour Guide
Ask me questions while you tour the home.