Estimated Value: $331,951 - $428,000
About This Home
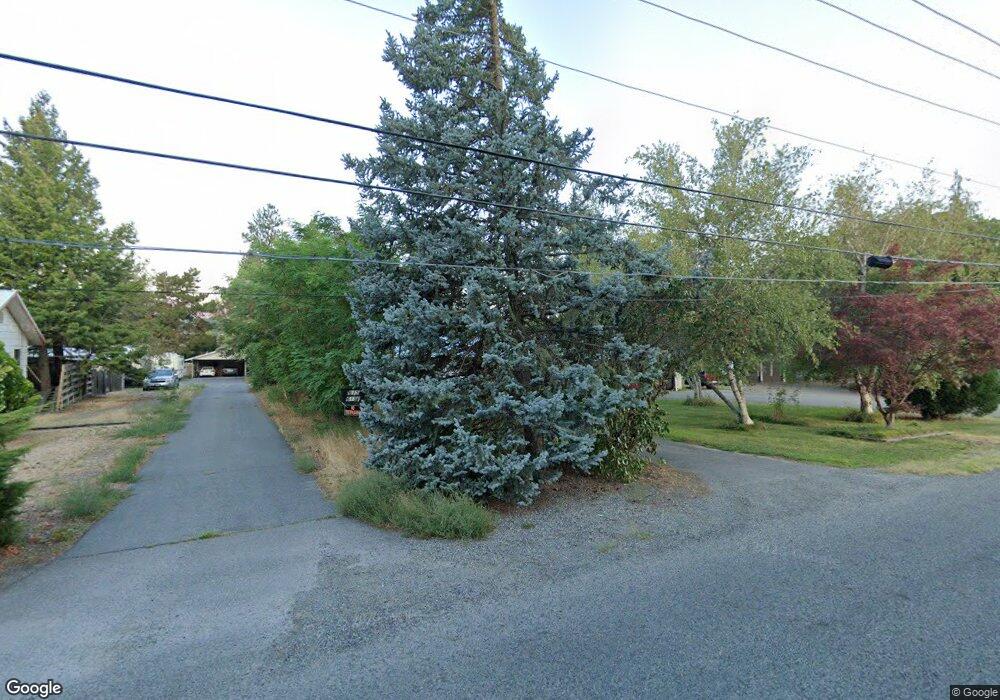
This home is located at 617 Locust St, Omak, WA 98841 and is currently estimated at $383,238, approximately $180 per square foot. 617 Locust St is a home located in Okanogan County with nearby schools including North Omak Elementary School, East Omak Elementary School, and Omak Middle School.
Ownership History
We collect this data history from publicly available records. To have your information removed, we recommend requesting removal directly through your county’s website.
Purchase Details
Home Financials for this Owner
Home Financials are based on the most recent Mortgage that was taken out on this home.Home Values in the Area
Average Home Value in this Area
Purchase History
We collect this data history from publicly available records. To have your information removed, we recommend requesting removal directly through your county’s website.
| Date | Buyer | Sale Price | Title Company |
|---|---|---|---|
| $186,000 | Baines Title Co |
Mortgage History
We collect this data history from publicly available records. To have your information removed, we recommend requesting removal directly through your county’s website.
| Date | Status | Borrower | Loan Amount |
|---|---|---|---|
| Open | $300,000 | ||
| Closed | $144,000 | ||
| Closed | $141,500 | ||
| Previous Owner | $65,000 | ||
| Previous Owner | $40,000 |
Tax History
We collect this data history from publicly available records. To have your information removed, we recommend requesting removal directly through your county’s website.
| Year | Tax Paid | Tax Assessment Tax Assessment Total Assessment is a certain percentage of the fair market value that is determined by local assessors to be the total taxable value of land and additions on the property. | Land | Improvement |
|---|---|---|---|---|
| 2026 | $416 | $355,100 | $30,200 | $324,900 |
| 2025 | $434 | $344,600 | $30,200 | $314,400 |
| 2024 | $434 | $334,100 | $30,200 | $303,900 |
| 2022 | $495 | $239,800 | $30,200 | $209,600 |
| 2021 | $737 | $239,800 | $30,200 | $209,600 |
| 2020 | $734 | $207,800 | $30,200 | $177,600 |
| 2019 | $709 | $207,800 | $30,200 | $177,600 |
| 2018 | $562 | $186,300 | $30,200 | $156,100 |
| 2017 | $771 | $186,300 | $30,200 | $156,100 |
| 2016 | $750 | $186,300 | $30,200 | $156,100 |
| 2015 | $747 | $185,300 | $30,200 | $155,100 |
| 2013 | -- | $185,300 | $30,200 | $155,100 |
Map
- 711 Locust St
- 612 Skyview Dr
- 519 Locust St
- 709 Paintbrush Ln
- 620 Skyview Dr
- 602 Ironwood St
- 222 Kenwood St N
- 222 Kenwood St
- 222 Kenwood St
- 703 Sunrise Dr
- 514 N Ash St
- 6 Nomak
- 10 Dewberry Ave W
- 224 E Bartlett Ave
- 534 E Dewberry Ave
- 527 N Ash St
- 504 N Ash St
- 46 Shumway Rd
- 605 Pinyon Place
- 216 Cherry Ave W
Ask me questions while you tour the home.