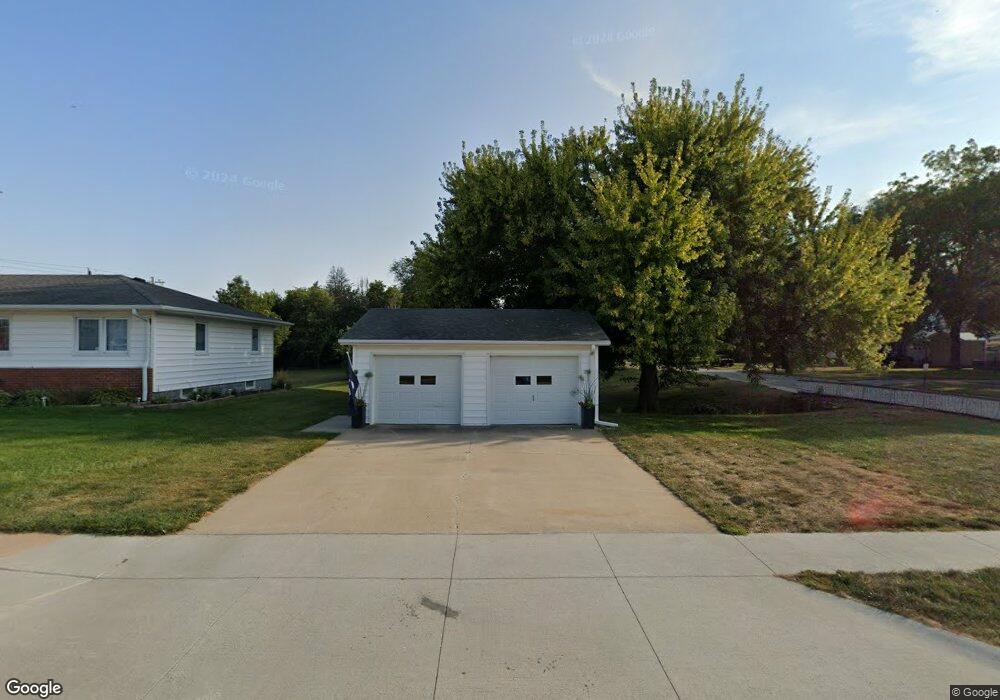
617 Maple St Pender, NE 68047
Estimated Value: $221,875 - $256,000
Studio
--
Bath
1,176
Sq Ft
$197/Sq Ft
Est. Value
About This Home
This home is located at 617 Maple St, Pender, NE 68047 and is currently estimated at $231,469, approximately $196 per square foot. 617 Maple St is a home located in Thurston County with nearby schools including Pender Elementary School and Pender High School.
Ownership History
Date
Name
Owned For
Owner Type
Purchase Details
Closed on
Jul 16, 2025
Sold by
Moore Spencer and Moore Chelsea
Bought by
Poley Adam J and Kubik Jenna J
Current Estimated Value
Home Financials for this Owner
Home Financials are based on the most recent Mortgage that was taken out on this home.
Original Mortgage
$11,000
Outstanding Balance
$5,578
Interest Rate
6.81%
Mortgage Type
FHA
Estimated Equity
$225,891
Purchase Details
Closed on
May 22, 2021
Sold by
Hegge Benjamin A and Hegge Paige
Bought by
Moore Spencer and Brinkman Chelsea
Home Financials for this Owner
Home Financials are based on the most recent Mortgage that was taken out on this home.
Original Mortgage
$161,500
Interest Rate
3%
Mortgage Type
New Conventional
Purchase Details
Closed on
Jun 16, 2020
Sold by
Krusemark Samantha
Bought by
Spencer Moore and Brinkman Chelsea
Purchase Details
Closed on
May 17, 2016
Sold by
Krusemark Bradley G
Bought by
Krusemark Samantha
Purchase Details
Closed on
Apr 8, 2014
Bought by
Krusemark Bradley G
Create a Home Valuation Report for This Property
The Home Valuation Report is an in-depth analysis detailing your home's value as well as a comparison with similar homes in the area
Purchase History
| Date | Buyer | Sale Price | Title Company |
|---|---|---|---|
| Poley Adam J | $220,000 | Madison County Abstract | |
| Moore Spencer | -- | New Title Company Name | |
| Spencer Moore | $160,000 | -- | |
| Krusemark Samantha | $162,500 | -- | |
| Krusemark Bradley G | $127,500 | -- |
Source: Public Records
Mortgage History
| Date | Status | Borrower | Loan Amount |
|---|---|---|---|
| Open | Poley Adam J | $11,000 | |
| Open | Poley Adam J | $216,015 | |
| Previous Owner | Moore Spencer | $161,500 |
Source: Public Records
Tax History
| Year | Tax Paid | Tax Assessment Tax Assessment Total Assessment is a certain percentage of the fair market value that is determined by local assessors to be the total taxable value of land and additions on the property. | Land | Improvement |
|---|---|---|---|---|
| 2025 | $3,315 | $217,550 | $17,040 | $200,510 |
| 2024 | $3,248 | $203,805 | $8,520 | $195,285 |
| 2023 | $3,695 | $186,625 | $8,520 | $178,105 |
| 2022 | $3,392 | $164,220 | $8,520 | $155,700 |
| 2021 | $2,642 | $133,890 | $8,520 | $125,370 |
| 2020 | $2,364 | $121,690 | $8,520 | $113,170 |
| 2019 | $2,089 | $111,400 | $8,520 | $102,880 |
| 2018 | $1,859 | $106,785 | $8,520 | $98,265 |
| 2017 | $1,778 | $106,785 | $8,520 | $98,265 |
| 2016 | $1,395 | $86,710 | $8,520 | $78,190 |
| 2015 | -- | $79,545 | $8,520 | $71,025 |
| 2014 | $1,384 | $79,545 | $8,520 | $71,025 |
| 2013 | -- | $69,260 | $8,520 | $60,740 |
Source: Public Records
Map
Nearby Homes
Your Personal Tour Guide
Ask me questions while you tour the home.