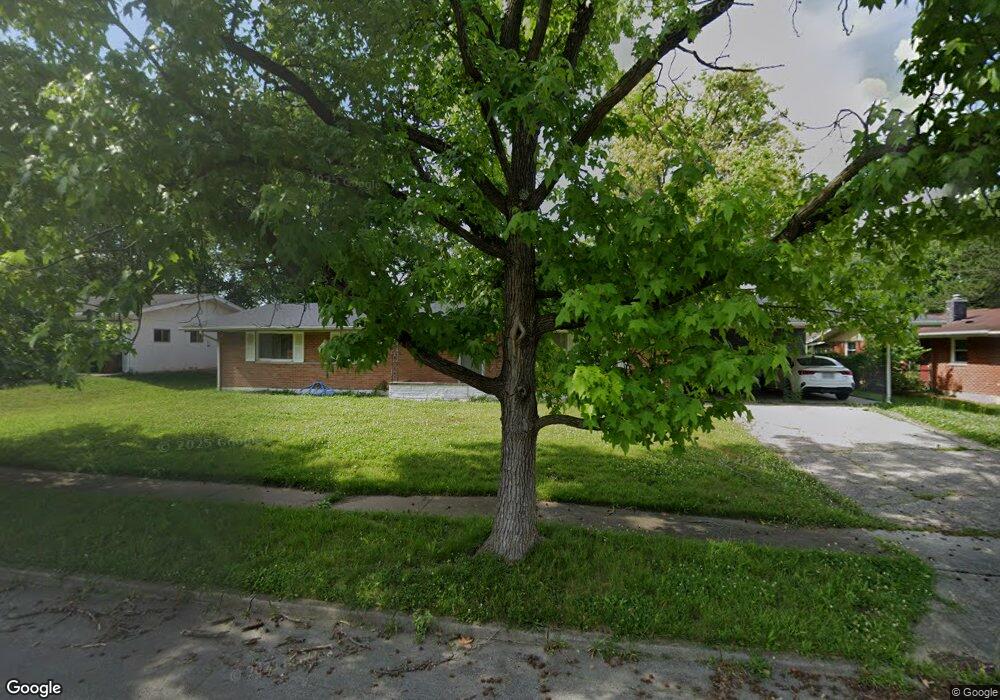
617 Mapleside Dr Dayton, OH 45426
Estimated Value: $122,000 - $159,000
3
Beds
2
Baths
1,458
Sq Ft
$101/Sq Ft
Est. Value
About This Home
This home is located at 617 Mapleside Dr, Dayton, OH 45426 and is currently estimated at $147,768, approximately $101 per square foot. 617 Mapleside Dr is a home located in Montgomery County with nearby schools including Trotwood-Madison Middle School, Trotwood-Madison High School, and Trotwood Preparatory & Fitness Academy.
Ownership History
Date
Name
Owned For
Owner Type
Purchase Details
Closed on
Dec 27, 2012
Sold by
Fannie Mae
Bought by
Trotwood Properties Lp
Current Estimated Value
Purchase Details
Closed on
Sep 26, 2012
Sold by
Thornton Bryan and Thornton Bryan Keith
Bought by
Fannie Mae and Federal National Mortgage Association
Purchase Details
Closed on
Jan 25, 2008
Sold by
Estate Of Lula Belle Brown
Bought by
Thornton Bryan
Purchase Details
Closed on
May 24, 2000
Sold by
Fane Diane M
Bought by
Brown Lula Belle
Home Financials for this Owner
Home Financials are based on the most recent Mortgage that was taken out on this home.
Original Mortgage
$67,500
Interest Rate
8.13%
Purchase Details
Closed on
Apr 17, 1995
Sold by
Rausch Jane A and Turner Jane A
Bought by
Fane Diane M
Purchase Details
Closed on
Mar 24, 1995
Sold by
Rausch Edward N
Bought by
Rausch Jane A and Turner Jane A
Create a Home Valuation Report for This Property
The Home Valuation Report is an in-depth analysis detailing your home's value as well as a comparison with similar homes in the area
Home Values in the Area
Average Home Value in this Area
Purchase History
| Date | Buyer | Sale Price | Title Company |
|---|---|---|---|
| Trotwood Properties Lp | $22,000 | Ohio Title Corp | |
| Fannie Mae | $44,000 | None Available | |
| Thornton Bryan | -- | None Available | |
| Brown Lula Belle | $84,400 | -- | |
| Fane Diane M | -- | Landmark Title | |
| Rausch Jane A | -- | -- |
Source: Public Records
Mortgage History
| Date | Status | Borrower | Loan Amount |
|---|---|---|---|
| Previous Owner | Brown Lula Belle | $67,500 |
Source: Public Records
Tax History
| Year | Tax Paid | Tax Assessment Tax Assessment Total Assessment is a certain percentage of the fair market value that is determined by local assessors to be the total taxable value of land and additions on the property. | Land | Improvement |
|---|---|---|---|---|
| 2025 | $358 | $30,230 | $6,110 | $24,120 |
| 2024 | $358 | $30,230 | $6,110 | $24,120 |
| 2023 | $358 | $30,230 | $6,110 | $24,120 |
| 2022 | $1,655 | $19,270 | $3,900 | $15,370 |
| 2021 | $1,658 | $19,270 | $3,900 | $15,370 |
| 2020 | $2,088 | $24,390 | $3,900 | $20,490 |
| 2019 | $1,109 | $11,470 | $2,840 | $8,630 |
| 2018 | $1,110 | $11,470 | $2,840 | $8,630 |
| 2017 | $1,104 | $11,470 | $2,840 | $8,630 |
| 2016 | $1,015 | $10,530 | $2,840 | $7,690 |
| 2015 | $999 | $10,530 | $2,840 | $7,690 |
| 2014 | $999 | $10,530 | $2,840 | $7,690 |
| 2012 | -- | $25,260 | $6,830 | $18,430 |
Source: Public Records
Map
Nearby Homes
- 709 N Eppington Dr
- 417 Vaniman Ave
- 717 Mapleside Dr
- 401 Stuckhardt Rd
- 708 Burman Ave
- 20 Macgregor Dr
- 808 Fairgrove Way
- 211 E Sunrise Ave
- 4 Pleasant Ave
- 16 Hillgard St
- 103 Oak St
- 4825 Olive Rd
- 7540 Tuscola Dr
- 512 N Sherry Dr
- 0 Trotwood Blvd Unit 952242
- 4051 Belmore Trace
- 7601 Springdawn Dr
- 7626 Morning Mist Cir
- 6440 Westanna Dr
- 330 Stubbs Dr
- 621 Mapleside Dr
- 613 Mapleside Dr
- 612 N Eppington Dr
- 616 N Eppington Dr
- 608 N Eppington Dr
- 625 Mapleside Dr
- 609 Mapleside Dr
- 616 Mapleside Dr
- 612 Mapleside Dr
- 620 Mapleside Dr
- 620 N Eppington Dr
- 604 N Eppington Dr
- 608 Mapleside Dr
- 624 Mapleside Dr
- 629 Mapleside Dr
- 605 Mapleside Dr
- 624 N Eppington Dr
- 600 N Eppington Dr
- 613 N Eppington Dr
- 617 Coleridge Ave
Your Personal Tour Guide
Ask me questions while you tour the home.