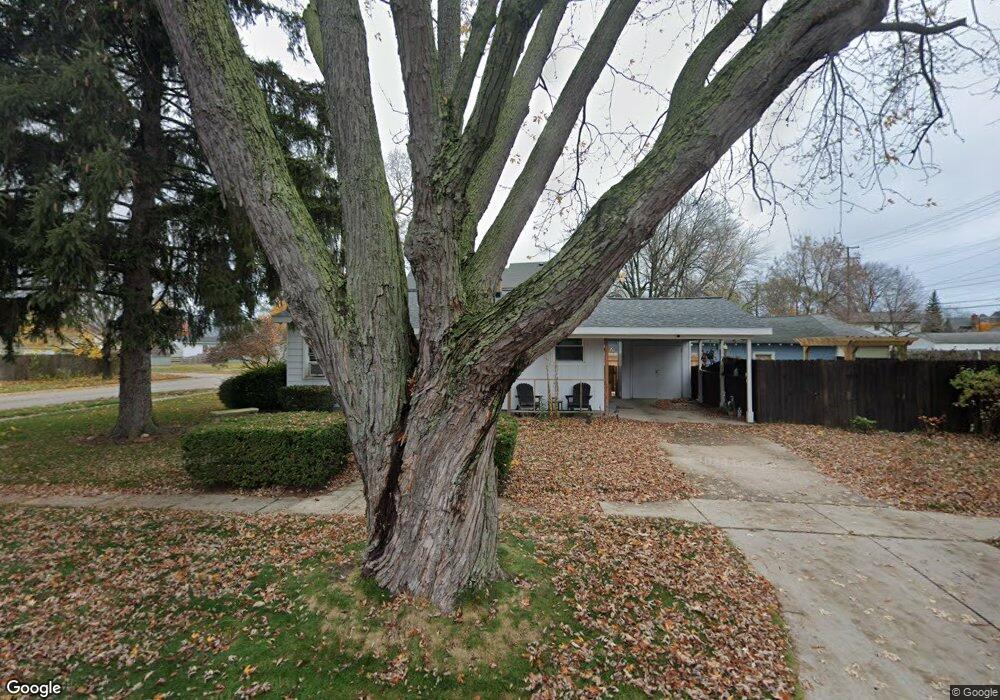
617 Minnie St Port Huron, MI 48060
Estimated Value: $102,000 - $117,000
2
Beds
1
Bath
825
Sq Ft
$134/Sq Ft
Est. Value
About This Home
This home is located at 617 Minnie St, Port Huron, MI 48060 and is currently estimated at $110,179, approximately $133 per square foot. 617 Minnie St is a home located in St. Clair County with nearby schools including Woodrow Wilson Elementary School, Central Middle School, and Port Huron High School.
Ownership History
Date
Name
Owned For
Owner Type
Purchase Details
Closed on
Dec 17, 2019
Sold by
Ball Robert D
Bought by
Ball William L
Current Estimated Value
Purchase Details
Closed on
Dec 11, 2019
Sold by
Ball Robert D
Bought by
Ball William L
Purchase Details
Closed on
Aug 23, 2017
Sold by
Ball Bradley and Ball Sandra
Bought by
Ball Robert
Create a Home Valuation Report for This Property
The Home Valuation Report is an in-depth analysis detailing your home's value as well as a comparison with similar homes in the area
Home Values in the Area
Average Home Value in this Area
Purchase History
| Date | Buyer | Sale Price | Title Company |
|---|---|---|---|
| Ball William L | -- | None Listed On Document | |
| Ball William L | -- | None Listed On Document | |
| Ball William L | -- | None Available | |
| Ball Robert | -- | -- |
Source: Public Records
Tax History Compared to Growth
Tax History
| Year | Tax Paid | Tax Assessment Tax Assessment Total Assessment is a certain percentage of the fair market value that is determined by local assessors to be the total taxable value of land and additions on the property. | Land | Improvement |
|---|---|---|---|---|
| 2025 | $1,182 | $45,200 | $0 | $0 |
| 2024 | $947 | $43,700 | $0 | $0 |
| 2023 | $895 | $39,300 | $0 | $0 |
| 2022 | $872 | $32,600 | $0 | $0 |
| 2021 | $828 | $28,700 | $0 | $0 |
| 2020 | $837 | $25,400 | $25,400 | $0 |
| 2019 | $823 | $17,800 | $0 | $0 |
| 2018 | $805 | $17,800 | $0 | $0 |
| 2017 | $1,029 | $16,900 | $0 | $0 |
| 2016 | $907 | $16,900 | $0 | $0 |
| 2015 | $984 | $16,800 | $16,800 | $0 |
| 2014 | $984 | $17,400 | $17,400 | $0 |
| 2013 | -- | $19,000 | $0 | $0 |
Source: Public Records
Map
Nearby Homes