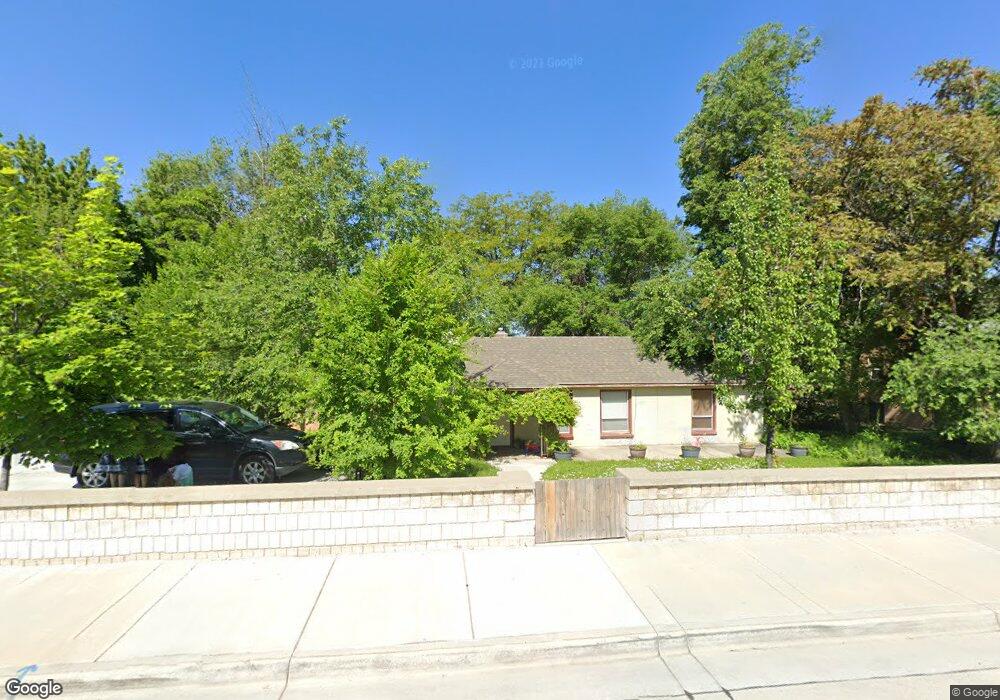
617 N 400 E Bountiful, UT 84010
Estimated Value: $435,914 - $531,000
3
Beds
1
Bath
1,706
Sq Ft
$274/Sq Ft
Est. Value
About This Home
This home is located at 617 N 400 E, Bountiful, UT 84010 and is currently estimated at $467,729, approximately $274 per square foot. 617 N 400 E is a home located in Davis County with nearby schools including Tolman School, Bountiful Junior High School, and Viewmont High School.
Ownership History
Date
Name
Owned For
Owner Type
Purchase Details
Closed on
Jul 11, 2020
Sold by
Martin Delon C and Martin Victoria E
Bought by
Martin Delon C and Martin Victoria E
Current Estimated Value
Purchase Details
Closed on
Mar 13, 2018
Sold by
Simmons Jeremy J and Simmons Brooke N
Bought by
Martin Delon C and Martin Victoria E
Home Financials for this Owner
Home Financials are based on the most recent Mortgage that was taken out on this home.
Original Mortgage
$202,000
Outstanding Balance
$172,720
Interest Rate
4.38%
Mortgage Type
New Conventional
Estimated Equity
$295,009
Purchase Details
Closed on
May 8, 2007
Sold by
Driggs Kenneth G and Driggs Carol Ann
Bought by
Simmons Jeremy J and Simmons Brooke N
Home Financials for this Owner
Home Financials are based on the most recent Mortgage that was taken out on this home.
Original Mortgage
$183,250
Interest Rate
6.17%
Mortgage Type
Purchase Money Mortgage
Create a Home Valuation Report for This Property
The Home Valuation Report is an in-depth analysis detailing your home's value as well as a comparison with similar homes in the area
Purchase History
| Date | Buyer | Sale Price | Title Company |
|---|---|---|---|
| Martin Delon C | -- | None Available | |
| Martin Delon C | -- | North American Title | |
| Simmons Jeremy J | -- | Wasatch Title Insurance |
Source: Public Records
Mortgage History
| Date | Status | Borrower | Loan Amount |
|---|---|---|---|
| Open | Martin Delon C | $202,000 | |
| Previous Owner | Simmons Jeremy J | $183,250 |
Source: Public Records
Tax History
| Year | Tax Paid | Tax Assessment Tax Assessment Total Assessment is a certain percentage of the fair market value that is determined by local assessors to be the total taxable value of land and additions on the property. | Land | Improvement |
|---|---|---|---|---|
| 2025 | $2,409 | $198,000 | $144,200 | $53,800 |
| 2024 | $2,259 | $194,700 | $139,949 | $54,751 |
| 2023 | $2,427 | $337,000 | $246,938 | $90,062 |
| 2022 | $2,139 | $183,700 | $132,095 | $51,605 |
| 2021 | $1,998 | $265,000 | $173,308 | $91,692 |
| 2020 | $1,778 | $234,000 | $144,272 | $89,728 |
| 2019 | $1,742 | $223,000 | $129,031 | $93,969 |
| 2018 | $1,605 | $200,000 | $125,993 | $74,007 |
| 2016 | $1,495 | $93,335 | $58,992 | $34,343 |
| 2015 | $1,402 | $81,180 | $58,992 | $22,188 |
| 2014 | $1,413 | $94,117 | $58,992 | $35,125 |
| 2013 | -- | $76,816 | $49,548 | $27,268 |
Source: Public Records
Map
Nearby Homes
- 513 N 400 E Unit 14B
- 453 N 400 E Unit 7-D
- 978 N 170 E
- 17 E 400 N Unit 19B
- 214 E 1250 N
- 683 E 100 N
- 49 E 200 N Unit 4
- 41 E 200 N Unit 6
- 55 E 200 N Unit 2
- 51 E 200 N Unit 3
- 256 N Main St
- 254 N Main St
- 252 N Main St
- 129 N 800 E
- 106 W 700 N
- 1420 N Main St
- 6 N 800 E
- 698 E 200 S
- 320 N 200 W Unit 4
- 499 N 200 W Unit 30
Your Personal Tour Guide
Ask me questions while you tour the home.