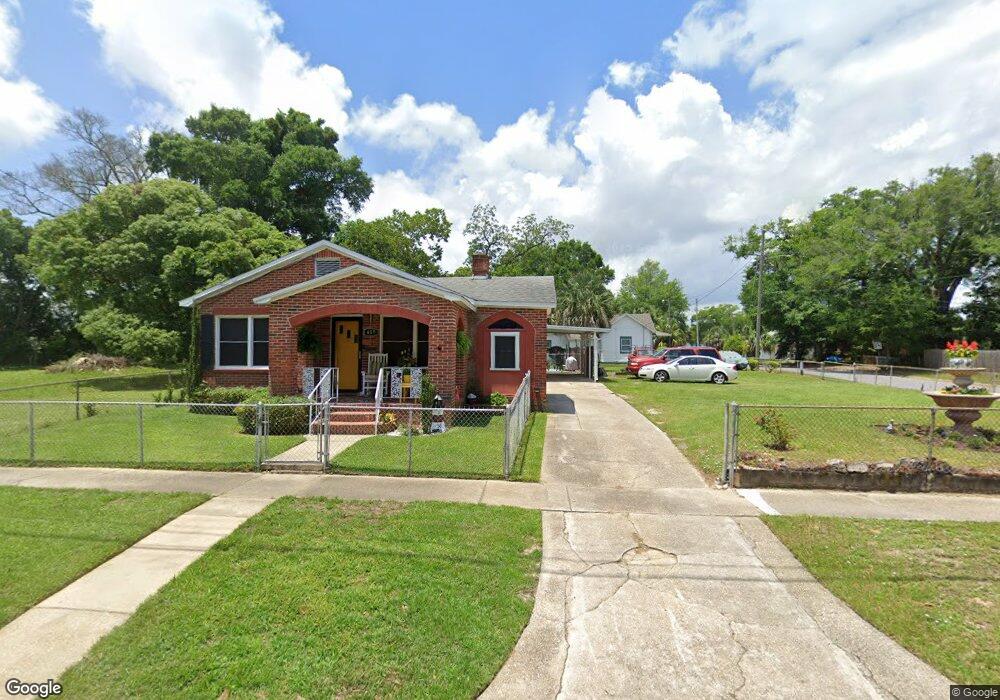
617 N E St Pensacola, FL 32501
Estimated Value: $223,000 - $373,000
Studio
2
Baths
1,641
Sq Ft
$174/Sq Ft
Est. Value
About This Home
This home is located at 617 N E St, Pensacola, FL 32501 and is currently estimated at $286,157, approximately $174 per square foot. 617 N E St is a home located in Escambia County with nearby schools including J.H. Workman Middle School, Pensacola High School, and Escambia Christian School.
Ownership History
Date
Name
Owned For
Owner Type
Purchase Details
Closed on
Sep 18, 2025
Sold by
Robinson Deborah Yvonne and Robinson Gerald Louis
Bought by
Robinson Deborah Yvonne and Robinson Gerald Louis
Current Estimated Value
Purchase Details
Closed on
Mar 26, 2019
Sold by
Hit 55 Properties Llc
Bought by
Robinson Deborah Yvonne
Purchase Details
Closed on
Feb 2, 2011
Sold by
Robinson Gerald L and Robinson Deborah Yvonne
Bought by
Robinson Deborah Yvonne
Purchase Details
Closed on
Jul 13, 2007
Sold by
Robinson Gerald Louis
Bought by
Robinson Gerald Louis and Robinson Deborah Yvonne
Create a Home Valuation Report for This Property
The Home Valuation Report is an in-depth analysis detailing your home's value as well as a comparison with similar homes in the area
Home Values in the Area
Average Home Value in this Area
Purchase History
| Date | Buyer | Sale Price | Title Company |
|---|---|---|---|
| Robinson Deborah Yvonne | $100 | None Listed On Document | |
| Robinson Deborah Yvonne | $12,000 | Attorney | |
| Robinson Deborah Yvonne | -- | None Available | |
| Robinson Gerald Louis | -- | None Available |
Source: Public Records
Tax History
| Year | Tax Paid | Tax Assessment Tax Assessment Total Assessment is a certain percentage of the fair market value that is determined by local assessors to be the total taxable value of land and additions on the property. | Land | Improvement |
|---|---|---|---|---|
| 2025 | $571 | $59,225 | -- | -- |
| 2024 | $532 | $57,556 | -- | -- |
| 2023 | $532 | $55,880 | $0 | $0 |
| 2022 | $527 | $54,253 | $0 | $0 |
| 2021 | $528 | $52,672 | $0 | $0 |
| 2020 | $515 | $52,075 | $0 | $0 |
| 2019 | $511 | $50,905 | $0 | $0 |
| 2018 | $512 | $49,956 | $0 | $0 |
| 2017 | $0 | $48,929 | $0 | $0 |
| 2016 | $489 | $47,923 | $0 | $0 |
| 2015 | -- | $47,590 | $0 | $0 |
| 2014 | -- | $47,213 | $0 | $0 |
Source: Public Records
Map
Nearby Homes
Your Personal Tour Guide
Ask me questions while you tour the home.